120 Data Breach Statistics for 2026
Updated:
September 16, 2026
Data breach costs hit a record $4.99 million globally in 2026, a 12% increase and the first rise after last year’s drop.
U.S. organizations faced the highest costs at $11.5 million, more than twice the global average.
Detection and containment took 247 days, reversing five consecutive years of improvement.
Attack patterns changed alongside rising costs.
Vulnerability exploitation overtook credential abuse as the top initial access vector, and nearly half of all breaches involved third-party compromise.
AI-enabled attacks became a measured category for the first time, accounting for one in four malicious breaches.
To give you a clear picture of data breaches worldwide, this article brings together 120 data breach statistics.
You’ll find figures from authoritative sources, including IBM’s Cost of a Data Breach Report 2026, Verizon’s 2026 Data Breach Investigations Report, annual data from the Identity Theft Resource Center, and records from the HHS Office for Civil Rights.
Each figure includes its source so you can verify the information and use it in your own research.
Let’s take a closer look at the numbers and what they mean for you!
Data Breach Costs in 2026
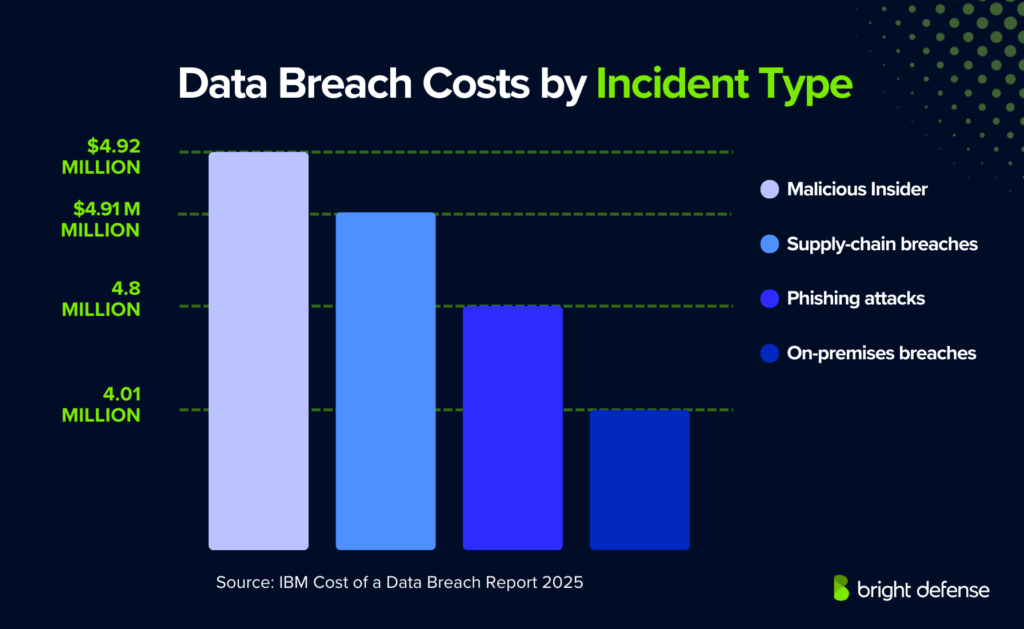
- The global average cost of a data breach reaches $4.99 million in 2026, up 12% from $4.44 million in 2025. The United States remains the most expensive market, with an average breach cost of $11.5 million. Detection and escalation costs plus lost-business costs account for 63% of the global average breach cost. (IBM Cost of a Data Breach Report 2026)
- Healthcare remained the costliest industry at $6.64 million, followed by financial services at $6.29 million. (IBM Cost of a Data Breach Report 2026)
- Among initial attack vectors, the following had the highest average breach costs:
- Voice and SMS phishing: USD 5.29 million.
- IT or help-desk impersonation: USD 5.23 million.
- Valid-account abuse: USD 5.07 million.
- Supply-chain compromise: USD 4.96 million. (IBM Cost of a Data Breach Report 2026)
- Breaches involving data stored across on-premises, private-cloud, and public-cloud environments averaged USD 5.39 million, the highest of IBM’s storage-location categories. Public-cloud breaches averaged USD 5.38 million, private-cloud breaches USD 4.62 million, and on-premises breaches USD 4.56 million. (IBM Cost of a Data Breach Report 2026)
- The type of data lost also influenced costs. Customer PII cost an average of USD 192 per compromised record in 2026. Intellectual property was even more expensive at USD 196 per record, making it the costliest data type measured by IBM. (IBM Cost of a Data Breach Report 2026)
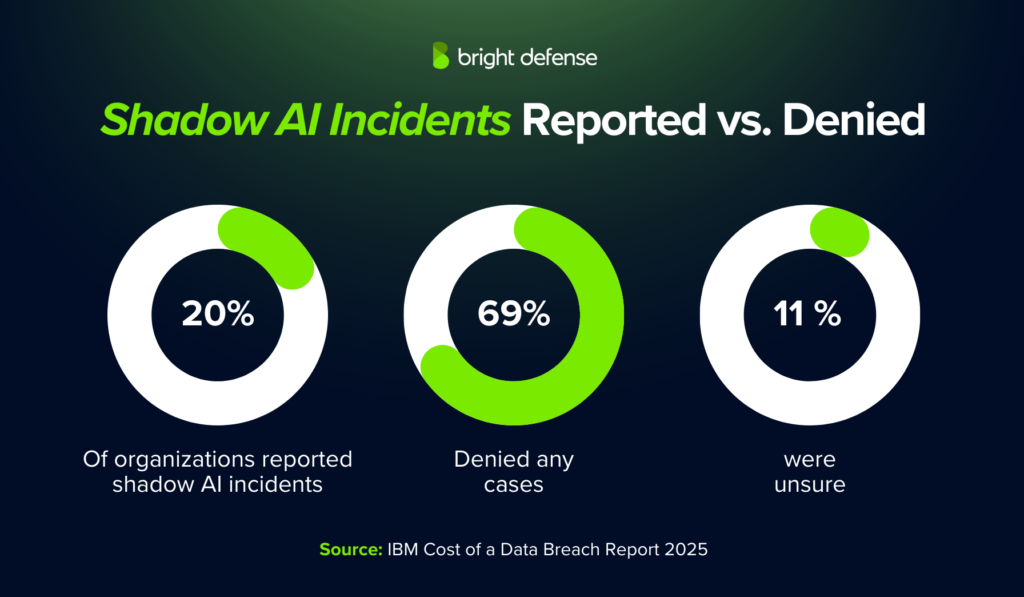
- Security incidents involving shadow AI averaged USD 5.39 million in 2026, up from USD 4.63 million in 2025. (IBM Cost of a Data Breach Report 2026)
- Malicious AI-driven breaches averaged USD 6.04 million in 2026, compared with USD 5.03 million for malicious breaches that were not AI-driven. (IBM Cost of a Data Breach Report 2026)
- Breaches involving an organization’s AI model or application averaged USD 5.33 million, compared with USD 4.70 million for organizations where AI was not involved or its involvement was unknown. (IBM Cost of a Data Breach Report 2026)
- Organizations extensively using security AI and automation averaged USD 4.00 million per breach, compared with USD 5.05 million for limited use and USD 5.93 million for no use. Extensive use was associated with USD 1.93 million lower costs than no use. (IBM Cost of a Data Breach Report 2026)
- Breaches identified and contained in fewer than 200 days averaged USD 4.32 million, compared with USD 5.65 million for breaches lasting longer than 200 days. (IBM Cost of a Data Breach Report 2026)
- Noncompliance with regulations added USD 201,112 to average breach costs, while a security skills shortage added USD 179,635 relative to IBM’s global average. (IBM Cost of a Data Breach Report 2026)
- IBM associated several security practices with lower breach costs: DevSecOps −USD 253,805, IAM −USD 225,622, offensive security testing −USD 211,339, and SOAR −USD 210,771 relative to the global average. (IBM Cost of a Data Breach Report 2026)
IBM’s 2026 analysis associated offensive security testing—including red teaming, penetration testing, and vulnerability testing—with USD 211,339 lower breach costs relative to the global average. See our 120+ penetration testing statistics for more data on testing practices, findings, and security outcomes.
AI Data Breaches and Security Automation
- Among organizations that experience an AI-related breach, 92% lack proper AI access controls. This broad measure differs from non-human identity protection: across all breached organizations, 46% protect service accounts and other non-human identities in AI workflows, and 30% of that group use role-based access controls. (IBM Cost of a Data Breach Report 2026) Frameworks like ISO 42001 compliance give organizations a structured approach to AI management system controls, access governance, and risk oversight.
- 21% of organizations reported breaches tied directly to their AI models or applications in 2026, up from 13% in 2025—a 61% increase. (IBM Cost of a Data Breach Report 2026)
- AI governance remained incomplete in 2026: 68% lacked fully implemented AI governance. Across organizations, 32% had policies in place, 35% had no policies, and 33% were developing policies. Reported governance measures included the following. (IBM Cost of a Data Breach Report 2026)
- Strict deployment approval: 38%
- AI governance technology: 33%
- AI governance frameworks: 33%
- Employee AI-risk training: 30%
- Audits for unsanctioned AI: 29%
- Adversarial testing and red teaming: 25%
- Governance and security coordination: 19%
- AI-related breaches produced the following impacts. (IBM Cost of a Data Breach Report 2026)
- Financial loss: 51%
- Operational disruption: 44%
- Unauthorized access to sensitive data: 44%
- Loss of data integrity: 32%
- Reputational damage: 26%
- AI deployments involved several sources. These third-party data breach patterns show how risk can extend beyond internally developed models. (IBM Cost of a Data Breach Report 2026)
- Open source: 26%
- Third-party SaaS: 26%
- Third-party vendor deployed on premises: 25%
- Trained in-house: 15%
- More than one in four malicious attacks were AI-driven, and AI-driven attacks increased by 56%. The most common attack types were: (IBM Cost of a Data Breach Report 2026)
- Deepfake and impersonation: 45%
- AI-enabled malware: 19%
- AI-generated phishing and communications: 17%
- Current AI-related incident types included the following. (IBM Cost of a Data Breach Report 2026)
- Connected apps, APIs, and plugins: 27%
- Cloud security misconfigurations: 27%
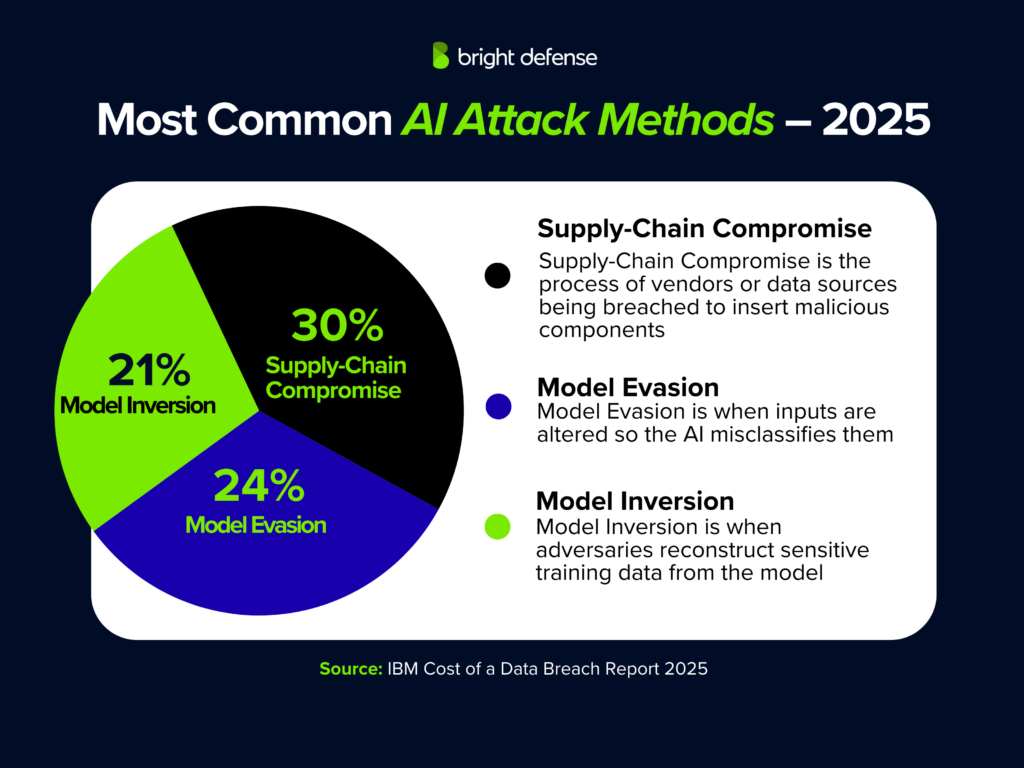
- Data poisoning: 26%
- Prompt injection: 25%
- Model inversion: 24%
- Shadow AI incidents rose to 43% from 20%. Reported consequences included: (IBM Cost of a Data Breach Report 2026)
- Data loss or compromise: 49%
- Operational disruption: 42%
- Reputational damage: 35%
- Increased security costs: 32%
- Regulatory fines: 21%
- Critical infrastructure sectors accounted for 62% of AI-driven attacks studied by IBM, with financial services and energy seeing the highest concentration. (IBM Cost of a Data Breach Report 2026)
- 50% of organizations deployed AI agents in their security operations centers. Common use cases included: (IBM Cost of a Data Breach Report 2026)
- Threat hunting: 56%
- Automated response and containment: 54%
- Threat investigation: 45%
- Alert triage: 34%
- Penetration testing: 33%
- Vulnerability scanning and management: 18%
- 45% of employees in Verizon’s dataset were regular AI users on corporate devices, up from 15%. Among those AI users, 67% accessed AI platforms using non-corporate accounts. (Verizon 2026 DBIR)
Data Breach Detection and Containment Times
Average Time to Detect and Contain a Breach
- IBM’s 2026 Cost of a Data Breach Report found that breaches took an average of 247 days to identify and contain, comprising 183 days to identify the breach and 64 days to contain it. The combined timeline increased 2.5% from 241 days in the 2025 report. (IBM Cost of a Data Breach Report 2026)
- Organizations extensively using security AI and automation averaged 215 days to identify and contain a breach in IBM’s 2026 study. This was 65 days shorter than the 280-day average among organizations using neither technology. Organizations with limited use averaged 244 days. (IBM Cost of a Data Breach Report 2026)
- In IBM’s 2026 study, breaches involving data stored across on-premises, private-cloud, and public-cloud environments took an average of 256 days to identify and contain, down from 277 days in the previous report. Public-cloud breaches averaged 251 days, on-premises breaches 244 days, and private-cloud breaches 240 days. (IBM Cost of a Data Breach Report 2026)
- Among the initial attack vectors shown in IBM’s 2026 lifecycle comparison, replication through removable media and supply-chain compromise each averaged 258 days to identify and contain. Social engineering involving IT or help-desk impersonation or MFA fatigue averaged 254 days, voice or SMS phishing 251 days, and valid-account abuse 243 days. (IBM Cost of a Data Breach Report 2026)
Attacker Dwell Time and Detection Sources
- Mandiant’s M-Trends 2026 report recorded a global median attacker dwell time of 14 days in its 2025 investigations, up from 11 days in 2024. Dwell time measures how long an attacker remains in a compromised environment before being detected. (M-Trends 2026)
- In Mandiant’s 2025 investigations, organizations detected malicious activity internally in 52% of cases, up from 43% in 2024. External entities, such as law enforcement or cybersecurity companies, provided the first notification in 34% of cases, while attackers disclosed the compromise in 14%. (M-Trends 2026)
- Sophos’s 2026 Active Adversary Report recorded a median dwell time of three days across its selected cases. Incident-response cases had a median of five days, compared with two days for cases involving managed detection and response customers. The report covers selected cases handled between November 2024 and October 2025. (Sophos 2026 Active Adversary Report)
Time to Lateral Movement and Data Theft
- Unit 42’s 2026 Global Incident Response Report recorded a median time to exfiltration of two days, measured from initial compromise to confirmed data theft. In its calendar-year comparison, the fastest 25% of intrusions reached exfiltration within 72 minutes in 2025, compared with 285 minutes in 2024. (Unit 42 Global Incident Response Report 2026)
- Average eCrime breakout time falls to 29 minutes in 2025 from 48 minutes in 2024, while the fastest observed breakout reaches 27 seconds. The average summarizes activity across cases; the fastest figure captures a single extreme. Breakout time measures lateral movement beyond the initial foothold. (CrowdStrike 2026 Global Threat Report)
Ransomware and Extortion Statistics for 2026
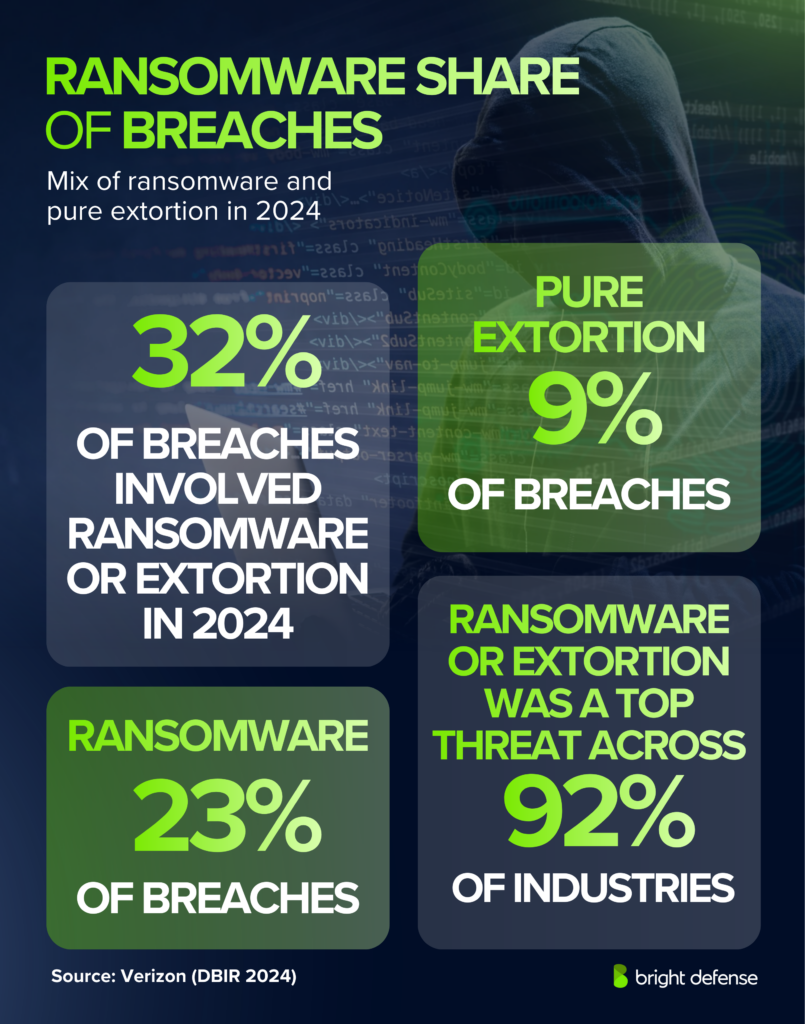
- Ransomware involvement reaches 48% of breaches in the Verizon 2026 DBIR, up from 44% in its previous dataset. In IBM’s separate study, ransomware incidence reaches 39% among breached organizations, up from 34% in its previous study. These percentages use different datasets and populations, so they are not directly comparable. (Verizon 2026 Data Breach Investigations Report; IBM Cost of a Data Breach Report 2026)
- The ITRC recorded 76 ransomware-related data compromise events in H1 2026, up 4.1% from 73 in H1 2025. However, 77.4% of cyberattack-related breach notices did not specify an attack vector, so this should not be treated as ransomware’s share of all U.S. breaches. (ITRC H1 2026 Data Breach Report)
- The FBI IC3 received more than 3,600 ransomware complaints in 2025, with reported direct losses exceeding $32 million. IC3 also identified 63 new ransomware variants during the year. (FBI 2025 IC3 Annual Report)
- Malicious email accounted for 26% of ransomware root causes in Sophos’s 2026 study, phishing 24%, compromised credentials 23%, and exploited vulnerabilities 18%. Overall, 79% of attacks began with an identity-based approach. (Sophos State of Ransomware 2026)
- 56% of ransomware attacks in Sophos’s study encrypted data: 40% involved encryption without confirmed theft and 16% involved both encryption and data theft. Another 41% were stopped before encryption, while 2% involved extortion without encryption. (Sophos State of Ransomware 2026)
- 69% of ransomware victims in Verizon’s 2026 dataset did not pay attackers. The median ransom payment fell to $139,875 from $150,000. (Verizon 2026 Data Breach Investigations Report)
- In Unit 42’s 2025 cases, median initial ransom demands represented 0.55% of perceived annual revenue, while median payments among organizations that paid represented 0.26%. The median reduction achieved during negotiated cases reached 61%. (Unit 42 Global Incident Response Report 2026)
- The average ransomware recovery cost, excluding ransom payments, reached $1,700,200 in Sophos’s 2026 study, up 11% from the previous report. (Sophos State of Ransomware 2026)
- Backup outcomes differ across incident-response and survey populations. In Unit 42’s 2025 incident-response cases, 41% of ransomware victims restore systems from backups without paying; in Sophos’s 2026 survey, 66% of encrypted-data cases use backup-based recovery. Unit 42 separately records backup-system impact in 26% of extortion cases. (Unit 42 Global Incident Response Report 2026; Sophos State of Ransomware 2026)
- Ransomware attacks involve the following six threats and types of data or systems targeted:
- Public shaming or threats to brand reputation appear in 41% of attacks.
- Employee personal data appears in 35% of attacks.
- Intellectual property appears in 31% of attacks.
- Customer data appears in 30% of attacks.
- Operational systems appear in 23% of attacks.
- Internal communications appear in 19% of attacks.
- Dual extortion accounted for 70% of ransomware claims in Coalition’s 2025 dataset and averaged about $299,000 in losses. Exfiltration-only and encryption-only claims each represented 15%, averaging roughly $205,000 and $138,000 respectively. (Coalition 2026 Cyber Claims Report)
- In Mandiant’s ransomware investigations, prior compromise was the most common confirmed initial infection vector at 30%, followed by exploits at 27%, brute force at 20%, and stolen credentials and web compromise at 10% each. (M-Trends 2026)
- Mandiant recorded a median ransomware dwell time of nine days in 2025, and 48.1% of ransomware-related intrusions were identified within one week. (M-Trends 2026)
- IBM X-Force identified 109 ransomware and extortion groups in 2025, up 49% from 73 in 2024. (IBM X-Force Threat Intelligence Index 2026)
Data Breach Causes and Exposed Data Types
Common Breach Causes and Initial Access Methods
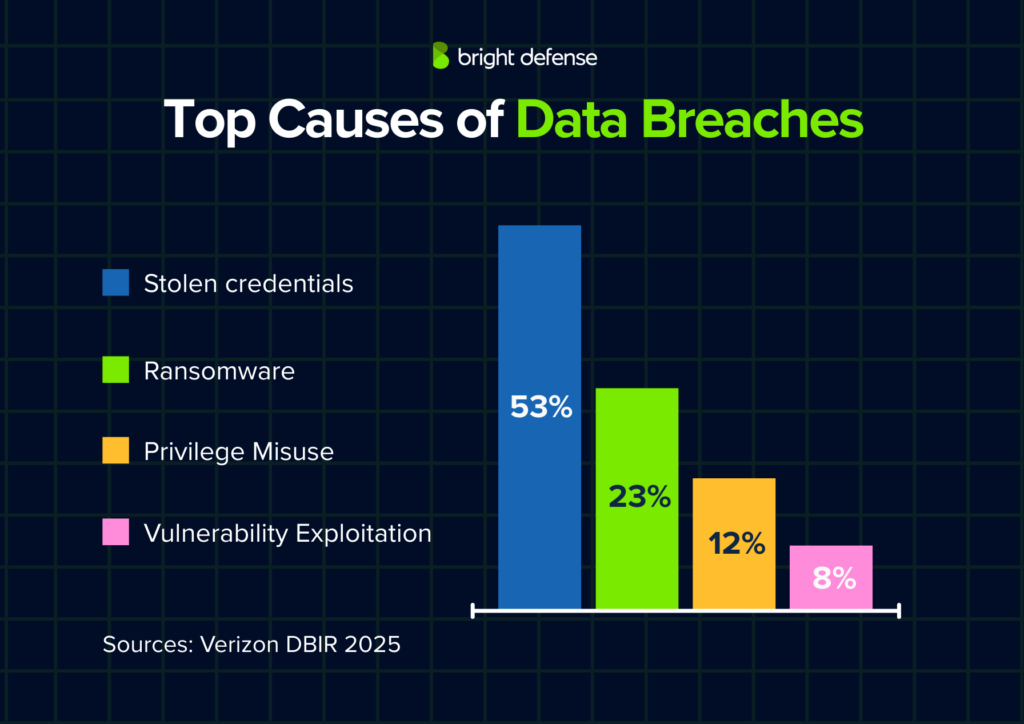
- Malicious or criminal attacks were the leading root cause in IBM’s 2026 study, accounting for 55% of breaches. Human error accounted for 23%, while IT failures accounted for 22%. (IBM Cost of a Data Breach Report 2026)
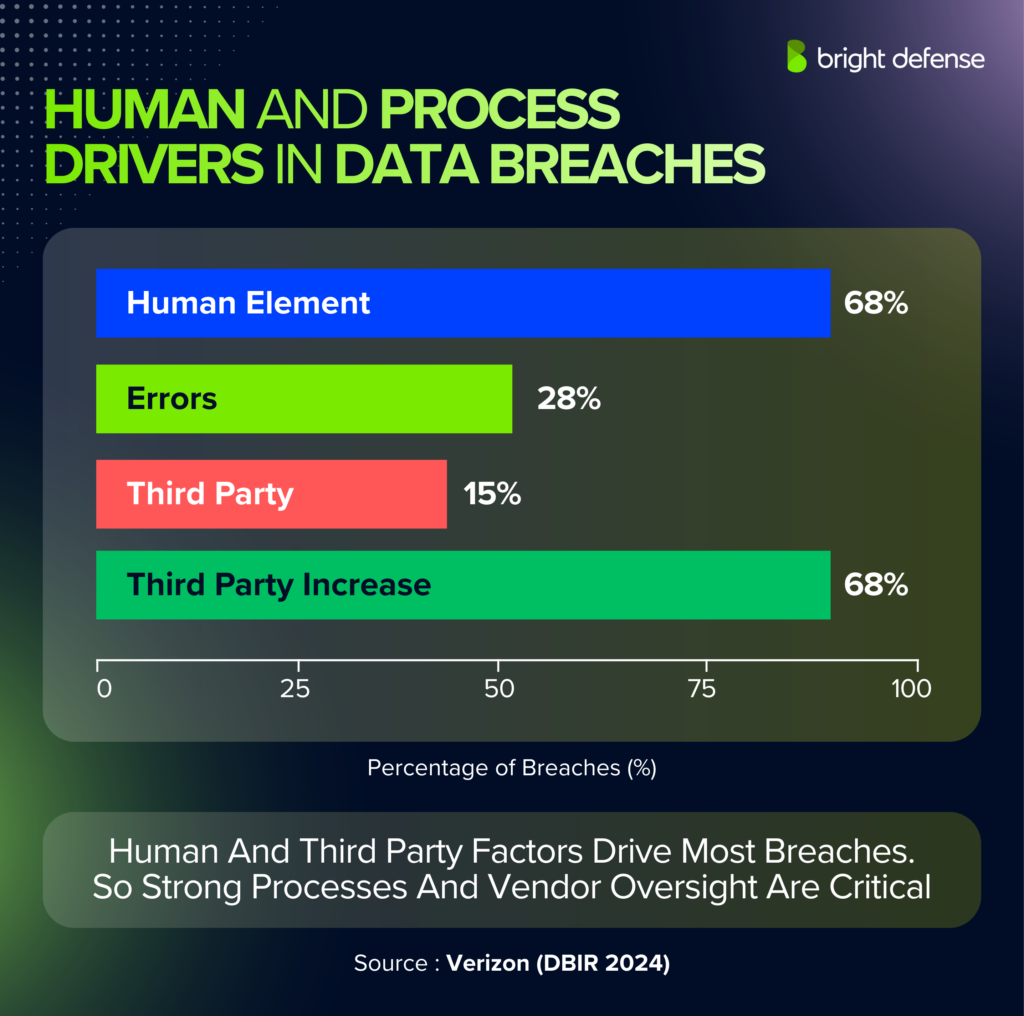
- Vulnerability exploitation became the most common initial access vector in the Verizon 2026 DBIR, appearing in 31% of non-Error, non-Misuse breaches. Phishing appeared in 16%, while credential abuse accounted for 13%. (Verizon 2026 DBIR)
- 39% of today’s breaches involve stolen or misused credentials. (Verizon 2026 DBIR)
- Privilege Misuse accounted for just under 4% of breaches in the Verizon 2026 DBIR, while Miscellaneous Errors represented nearly 9%. (Verizon 2026 DBIR)
- Only 26% of CISA Known Exploited Vulnerabilities identified in organizations were fully remediated in Verizon’s analysis, down from 38%. Median time to full remediation rose from 32 to 43 days, while the median number of KEVs organizations had to address increased from 11 to 16. (Verizon 2026 DBIR)
- In Mandiant’s 2025 incident-response investigations, exploits accounted for 32% of identified initial infection vectors, voice phishing 11%, stolen credentials 9%, and email phishing 6%. (M-Trends 2026)
- Identity-driven techniques account for 65% of initial access in Unit 42’s 2025 incident-response cases. Phishing and vulnerability exploitation each account for 22%, followed by previously compromised credentials at 13%, other social engineering at 11%, and brute force at 8%. (Unit 42 Global Incident Response Report 2026)
- Google Threat Intelligence Group estimated mean time to exploit at −7 days in 2025, meaning exploitation occurred, on average, before a patch became available. The estimate was −1 day in 2024 and 63 days in 2018. (M-Trends 2026)
- External actors were involved in 88% of breaches in the Verizon 2026 DBIR, while internal actors appeared in 12%. Organized criminal groups dominated external threat activity, while state-affiliated actors appeared in close to 15% of breaches. (Verizon 2026 DBIR)
- Financial gain remained the leading breach motive in Verizon’s dataset at 68%, while espionage accounted for 13%. (Verizon 2026 DBIR)
- Internal data was the most commonly compromised data type in Verizon’s 2026 dataset, appearing in 67% of breaches. Credentials appeared in 28%, personal data in 23%, and sensitive personal information in 1.7%. (Verizon 2026 DBIR)
- Only 24% of H1 2026 breach notices tracked by the Identity Theft Resource Center disclosed how the breach occurred. Among cyberattack-related events, 77.4% listed the attack vector as “Not Specified,” highlighting a major limitation in public attack-vector data. (ITRC H1 2026 Data Breach Report)
Human Error and Social Engineering in Data Breaches
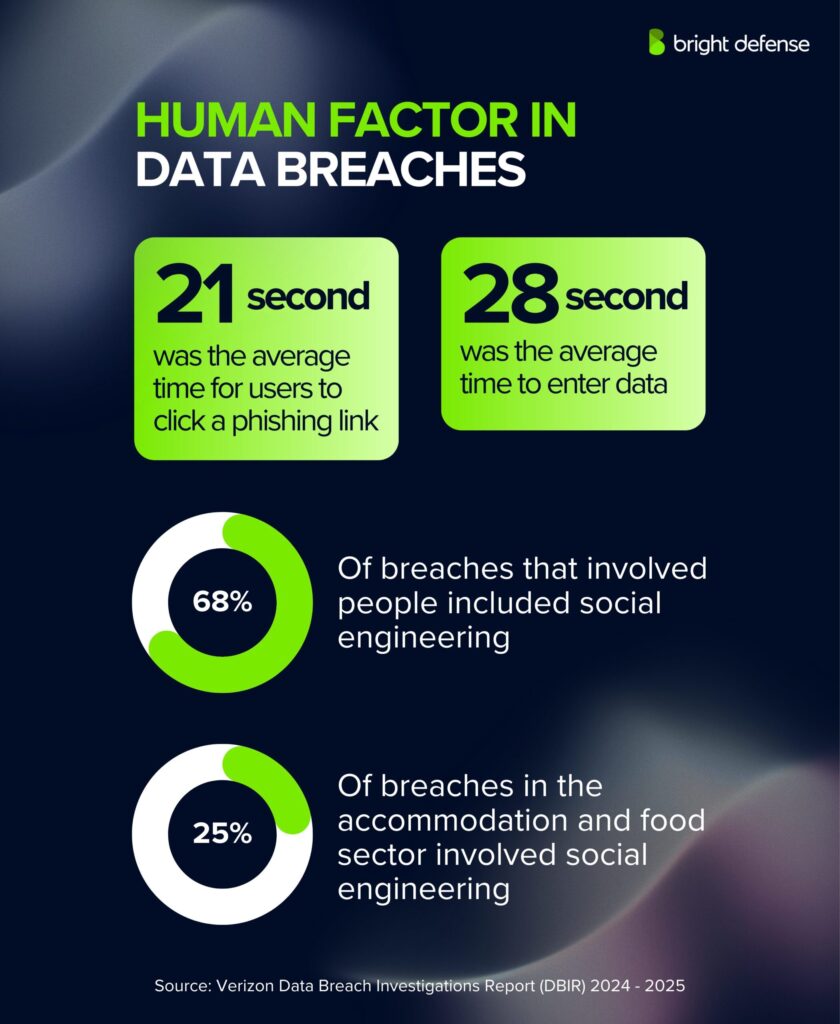
- The human element was present in 62% of data breaches, up from 60% the previous year. ((Verizon 2026 DBIR)
- Social engineering was the third most common breach pattern, accounting for 16% of breaches. A total of 5,302 social engineering incidents were analyzed, including 3,814 with confirmed data disclosure. (Verizon 2026 DBIR)
- 41% of social engineering breaches involved at least one social vector other than email. About one-quarter of social attack vectors involved either social media or phones. (Verizon 2026 DBIR)
- Phone-centric social engineering simulations had a median success rate of about 2%, compared with 1.4% for email phishing simulations. That represents a 40% higher median success rate. (Verizon 2026 DBIR)
- Pretexting reached 6% of breaches and became a more common initial access vector in ransomware and extortion attacks, while phishing remained at 16%. (Verizon 2026 DBIR)
- Voice phishing accounted for 11% of identified initial infection vectors in 2025, making it the second most common vector. Email phishing fell to 6%, down from 14% in 2024. (M-Trends 2026)
- Phishing, smishing, and Business Email Compromise were the most common named cyberattack vector in H1 2026, with 157 recorded events. (ITRC)
- Voice and SMS phishing were used in 17% of attacks against breached organizations, while social engineering techniques such as IT or help-desk impersonation and MFA fatigue were used in 13%. (IBM Cost of a Data Breach Report 2026)
- Credentials were compromised in 39% of social engineering breaches, while secrets were compromised in 31%. Financial gain was a motive in 86% of social engineering breaches. (Verizon 2026 DBIR)
- Business Email Compromise accounted for 31% of cyber insurance claims in 2025. BEC claim frequency increased 15% year over year to 0.47%, while the average BEC claim loss fell 28% to $27,000. (Coalition 2026 Cyber Claims Report)
- 24,768 Business Email Compromise complaints were reported in 2025, up from 21,442 in 2024. Reported BEC losses reached $3.05 billion, compared with $2.77 billion the previous year. (FBI 2025 IC3 Annual Report)
Did you know cybercrime costs keep climbing every year? Explore 250+ cybercrime stats that show the true scale of online threats.
Third-Party and Supply Chain Data Breaches
- Third parties were involved in 48% of data breaches, up from 30% the previous year—a 60% increase. (Verizon)
- Just 38 initial supply chain breaches or exposures affected 206 organizations and generated more than 280.6 million victim notices in H1 2026. (ITRC)
- Supply chain compromise was the second most common initial attack vector among breached organizations and resulted in an average breach cost of $4.96 million. (IBM)
- Supply chain breaches took an average of 258 days to identify and contain—194 days to identify the breach and another 64 days to contain it. (IBM)
- Third-party compromise accounted for 5% of identified initial infection vectors in 2025 incident-response investigations, including incidents involving compromised SaaS platforms. (Mandiant)
- Data from SaaS applications was relevant to 23% of incident-response cases in 2025, up from 18% in 2024, 12% in 2023, and 6% in 2022. (Unit 42)
- Only 23% of third-party organizations fully remediated missing or improperly configured MFA on cloud accounts. Half of the identified MFA issues were resolved within about one month. (Verizon)
- Weak-password and excessive-permission issues in third-party cloud environments took almost eight months for half of the findings to be resolved, while only 31% were fully remediated. (Verizon)
- The number of major supply chain or third-party breaches increased by approximately four times over the past five years. (IBM X-Force)
- 65% of large companies identified third-party and supply chain vulnerabilities as one of their greatest challenges to cyber resilience in 2026, up from 54% the previous year. (World Economic Forum)
- 66% of organizations assess the security maturity of their suppliers and 65% involve security teams in procurement, but only 33% comprehensively map their supply chain ecosystems and 27% conduct cyber incident or recovery exercises with ecosystem partners. (World Economic Forum)
Note: Third-party involvement and supply chain compromise are related but not identical. The 48% Verizon figure includes vendor software, vendors hosting an organization’s data, and vendors connected to an organization’s environment; it should not be described as meaning that 48% of breaches were software supply chain attacks.
Data Breach Recovery Times and Business Impact
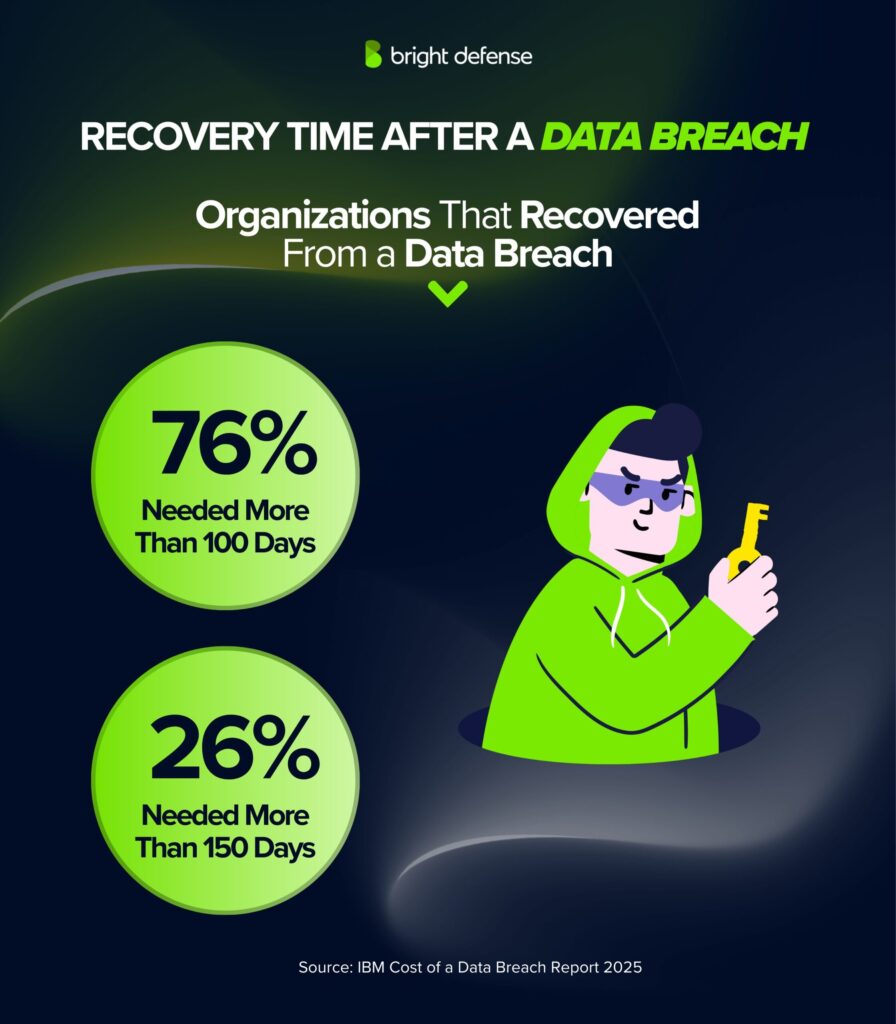
- 42% of breached organizations had fully recovered, up from 35% the previous year and just 12% in 2024. Another 58% had not yet fully recovered. (IBM — Cost of a Data Breach Report 2026)
- Only 4% of organizations that fully recovered did so in less than 50 days, compared with 2% the previous year. (IBM — Cost of a Data Breach Report 2026)
- 29% of fully recovered organizations needed 101–125 days to recover, 23% needed 126–150 days, and 19% took more than 150 days. (IBM — Cost of a Data Breach Report 2026)
- The share of organizations taking more than 150 days to fully recover fell from 26% to 19%. (IBM — Cost of a Data Breach Report 2026)
- Post-breach response costs increased 15% year over year to an average of $1.36 million. These costs include legal expenses, regulatory fines, credit monitoring, and other post-breach response activities. (IBM — Cost of a Data Breach Report 2026)
- 22% of organizations ranked insufficient incident response and recovery planning among their biggest challenges to cyber resilience. (World Economic Forum — Global Cybersecurity Outlook 2026)
- Nearly 40% of small organizations raised prices for goods or services to help cover cyberattack remediation and recovery costs. (ITRC — 2025 Annual Data Breach Report)
- 55% of organizations recovered from a ransomware attack within one week, including 16% in less than a day. Overall, 83% recovered within one month, while only 3% took longer than three months. (Sophos — State of Ransomware 2026)
- 99% of organizations whose data was encrypted by ransomware reported lasting effects on their IT and cybersecurity teams. 41% reported increased anxiety or stress about future attacks, 40% faced greater pressure from senior leaders, and 21% replaced the team’s leadership following the attack. (Sophos — State of Ransomware 2026)
Security Investments and Staffing Priorities
- 64% of breached organizations planned to increase their security investments, a 30% increase from the previous year.
(IBM — Cost of a Data Breach Report (2026) - Among breached organizations aware of new frontier AI model threats, 85% planned to increase security spending, compared with 64% before becoming aware of those threats.
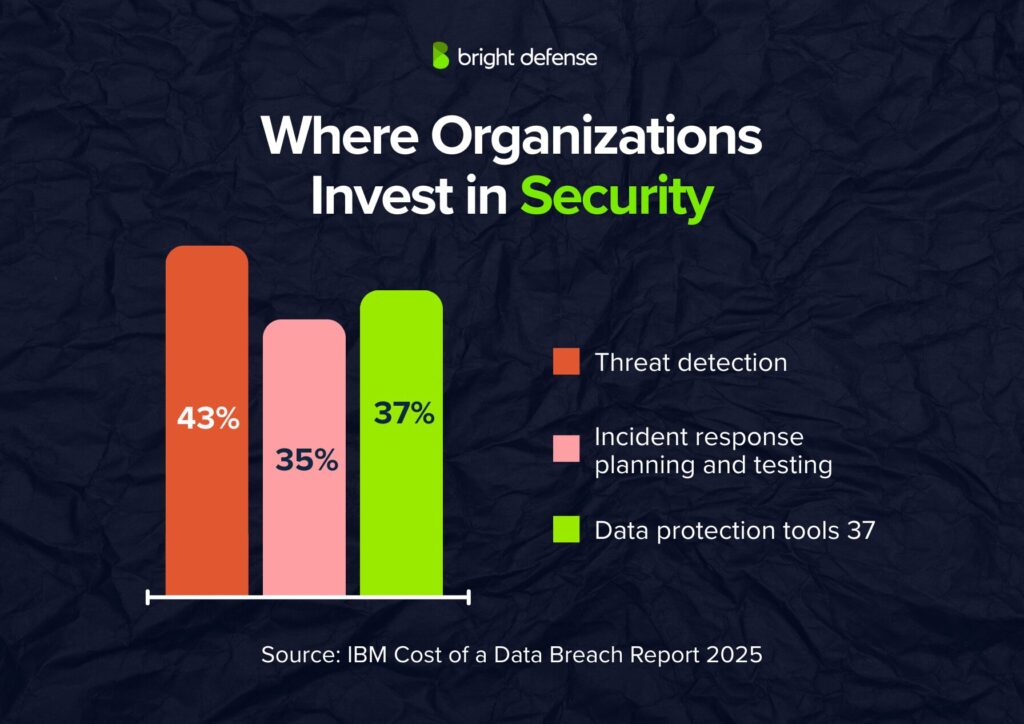
(IBM — Cost of a Data Breach Report (2026) - Hiring skilled specialists was the leading investment priority at 45%, followed by incident response plans and testing at 43% and identity and access management at 41%.
(IBM — Cost of a Data Breach Report (2026) - 34% planned to increase investment in threat detection and response technologies such as SIEM, SOAR, and EDR, while another 34% prioritized AI security and governance tools. Managed security services and cryptography management tools were each selected by 33%.
(IBM — Cost of a Data Breach Report (2026) - 31% planned greater investment in employee training and 31% in quantum security for data and data transfers. Data loss prevention was selected by 30%, while 26% planned more spending on offensive security testing such as red teaming, penetration testing, and vulnerability testing.
(IBM — Cost of a Data Breach Report (2026) - Investment in skilled specialists rose from 27% to 45% year over year, while IAM increased from 26% to 41% and incident response planning and testing rose from 35% to 43%. At the same time, planned investment in threat detection and response fell from 43% to 34%, data loss prevention declined from 37% to 30%, and offensive security testing fell from 32% to 26%.
(IBM — Cost of a Data Breach Report (2026) - Only 22% of highly cyber-resilient organizations reported lacking the workforce needed to achieve their cybersecurity objectives, compared with 85% of organizations with insufficient cyber resilience.
(World Economic Forum — Global Cybersecurity Outlook (2026)
Healthcare Data Breach Statistics for 2026
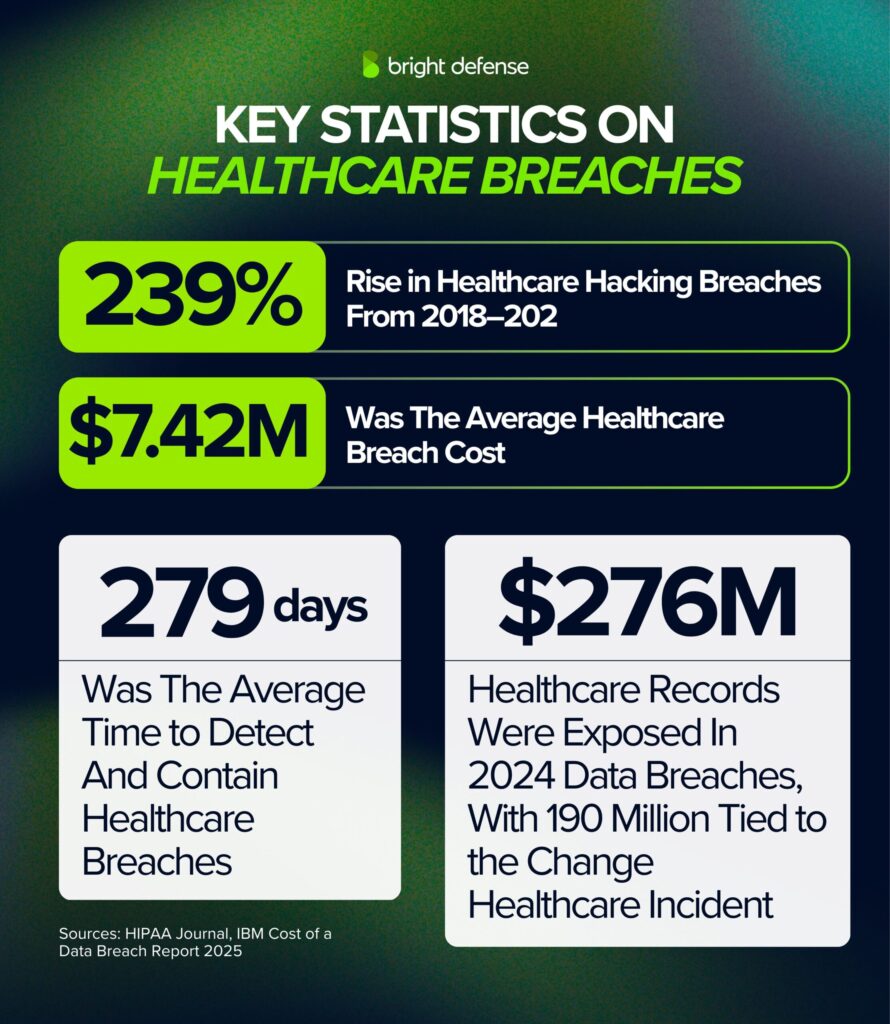
- Healthcare recorded 281 data compromises in H1 2026, up from 270 in H1 2025. Those incidents generated approximately 11.7 million victim notices. (ITRC — H1 2026 Data Breach Report)
- Healthcare breaches cost an average of $6.64 million in 2026, the highest of any industry for the 13th consecutive year. The average fell 10.5% from $7.42 million the previous year. (IBM — Cost of a Data Breach Report 2026)
- Verizon analyzed 1,438 healthcare breaches with confirmed data disclosure. System Intrusion, Miscellaneous Errors, and Social Engineering accounted for 81% of those breaches. (Verizon — 2026 Data Breach Investigations Report)
- External actors were involved in 81% of healthcare breaches, compared with 19% involving internal actors. Financial gain was a motive in 99% of healthcare breaches. (Verizon — 2026 Data Breach Investigations Report)
- Vulnerability exploitation was the leading initial access vector in healthcare breaches at 20%, followed by phishing at 14% and credential abuse at 11%. (Verizon — 2026 Data Breach Investigations Report)
- The human element was present in 54% of healthcare breaches, while third parties were involved in 32%. System Intrusion also remained the sector’s leading breach pattern and was largely driven by ransomware. (Verizon — 2026 Data Breach Investigations Report)
- 93% of surveyed U.S. healthcare organizations experienced at least one cyberattack in the previous 12 months. Among those organizations, the average number of attacks increased to 43, from 40 the previous year. (Proofpoint/Ponemon Institute — Cyber Insecurity in Healthcare 2025)
- An average of 72% of healthcare organizations affected by the four cyberattack types studied reported disruption to patient care, up from 69% the previous year. Across those attacks, 54% reported increased complications from medical procedures, 53% reported longer patient stays, and 29% reported increased mortality rates. (Proofpoint/Ponemon Institute — Cyber Insecurity in Healthcare 2025)
- 44% of surveyed healthcare organizations experienced a supply chain attack, down from 68% in 2024. Among affected organizations, 87% reported disruption to patient care. (Proofpoint/Ponemon Institute — Cyber Insecurity in Healthcare 2025)
- Over the two-year period studied, 72% of healthcare organizations experienced cloud or account compromises, 62% experienced BEC, spoofing, or impersonation attacks, 61% experienced ransomware attacks, and 44%experienced supply chain attacks. (Proofpoint/Ponemon Institute — Cyber Insecurity in Healthcare 2025)
- 96% of surveyed healthcare organizations experienced at least two data loss or exfiltration incidents involving sensitive healthcare data over two years, with an average of 18 incidents per organization. 55% said these incidents affected patient care. (Proofpoint/Ponemon Institute — Cyber Insecurity in Healthcare 2025)
- Employee failure to follow policies was the leading reported cause of healthcare data loss or exfiltration incidents at 35%. Privileged-access abuse and employees accidentally sending PII or PHI to the wrong email recipient were each reported by 25%. (Proofpoint/Ponemon Institute — Cyber Insecurity in Healthcare 2025)
Read our Healthcare Data Breach Statistics for a deeper look at healthcare-specific breach trends, costs, attack methods, and patient impact.
Data Breach Statistics by Industry
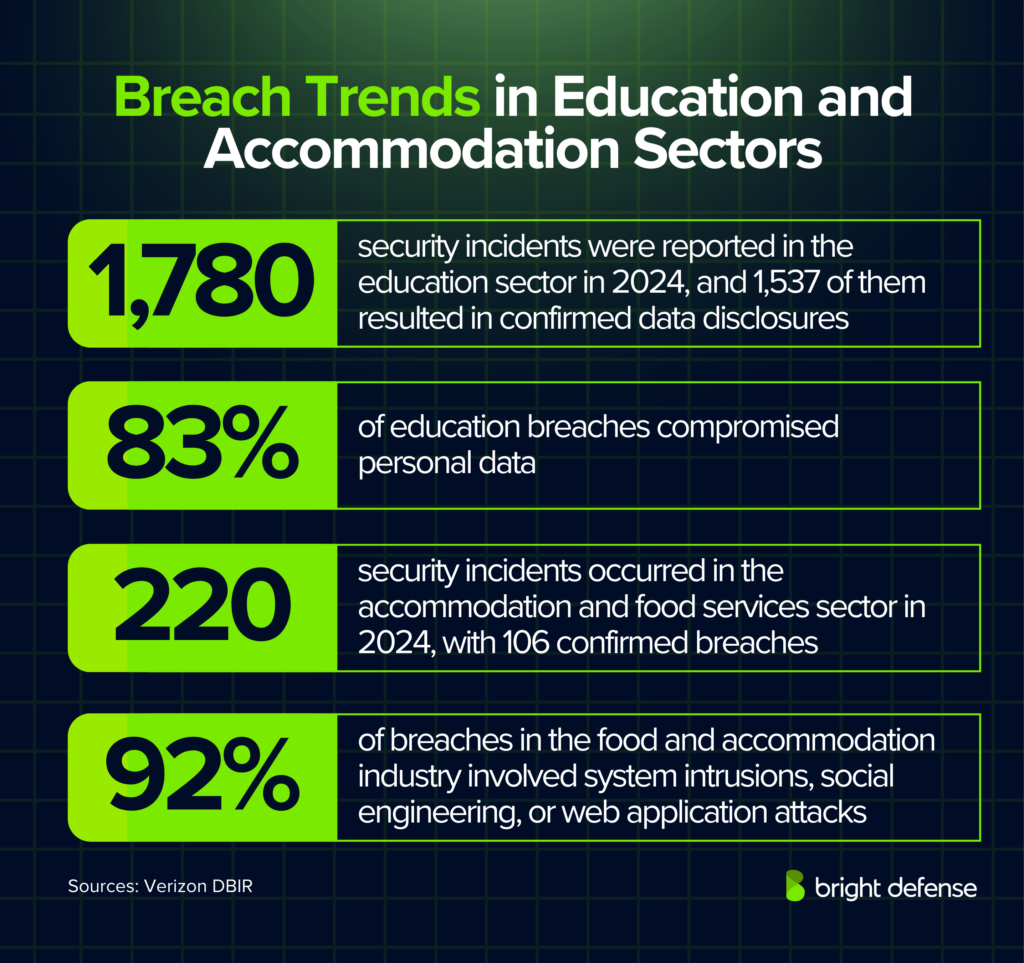
- Verizon analyzed 1,302 security incidents in Educational Services, including 1,252 confirmed breaches. External actors were involved in 78% of breaches, while 78% were financially motivated. (Verizon — 2026 Data Breach Investigations Report)
- System Intrusion accounted for 52% of education breaches, compared with 17% for Social Engineering and 16% for Miscellaneous Errors. Together, the three patterns represented 83% of education breaches. (Verizon — 2026 Data Breach Investigations Report)
- Vulnerability exploitation was the leading initial access vector in education breaches at 34%, followed by phishing at 22% and credential abuse at 8%. The human element was present in 68% of education breaches, while third parties were involved in 40%. (Verizon — 2026 Data Breach Investigations Report)
- Ransomware appeared in 65% of malware-related education breaches. Web applications were the infection vector in 71% of the analyzed cases, while email attachments appeared in 52%. (Verizon — 2026 Data Breach Investigations Report)
- Financial and Insurance organizations accounted for 3,809 incidents and 1,300 confirmed breaches in Verizon’s dataset. External actors were involved in 88% of breaches, and financial gain was a motive in 98%. (Verizon — 2026 Data Breach Investigations Report)
- In Financial and Insurance breaches, vulnerability exploitation accounted for 22% of initial access, phishing for 20%, and credential abuse for 15%. The human element was present in 65%, while third parties were involved in 34%. (Verizon — 2026 Data Breach Investigations Report)
- Verizon analyzed 3,627 manufacturing incidents, including 2,713 confirmed breaches. Malware appeared in 75% of manufacturing breaches, with ransomware accounting for 61%. (Verizon — 2026 Data Breach Investigations Report)
- Third parties were involved in 61% of manufacturing breaches and the human element in 56%. Vulnerability exploitation was the leading initial access vector at 38%, followed by phishing at 13% and credential abuse at 11%. (Verizon — 2026 Data Breach Investigations Report)
- Retail recorded 997 incidents and 806 confirmed breaches. External actors were involved in 99% of breaches, third parties in 68%, and vulnerability exploitation accounted for 42% of initial access. (Verizon — 2026 Data Breach Investigations Report)
- In H1 2026, Financial Services led U.S. industries with 387 publicly reported compromises, followed by Professional Services with 269, Manufacturing with 189, Technology with 99, and Education with 90. (ITRC — H1 2026 Data Breach Report)
- Manufacturing generated approximately 74 million victim notices in H1 2026—about 37.6 times its full-year 2025 total—while Hospitality generated approximately 15.5 million, or 23.9 times its full-year 2025 total. (ITRC — H1 2026 Data Breach Report)
Data Breach Counts and Victim Notifications
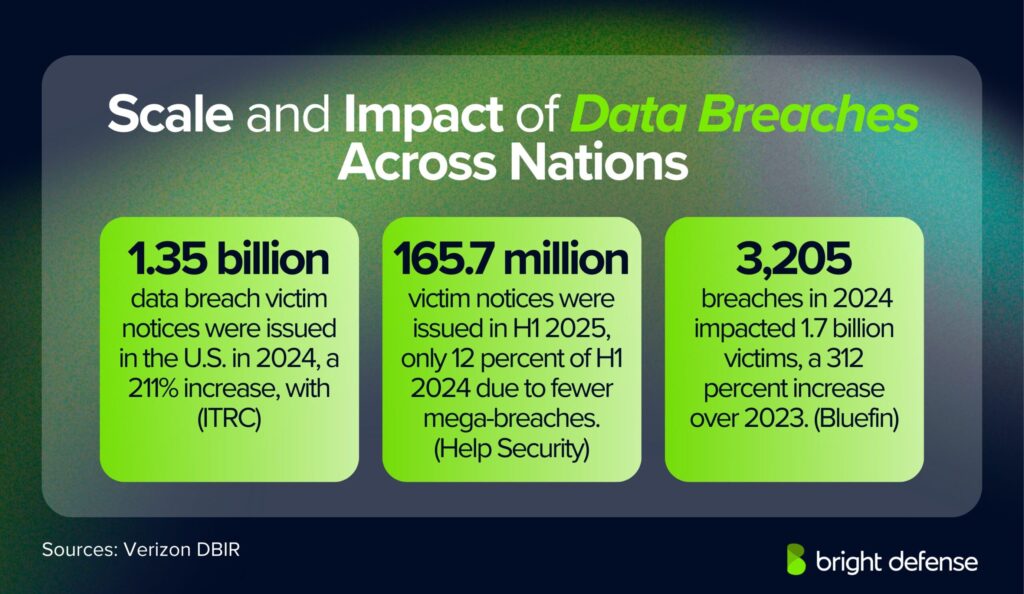
- Verizon analyzed 31,861 security incidents and 22,625 confirmed data breaches involving organizations in 145 countries—the largest breach dataset examined in a single DBIR to date. (Verizon — 2026 Data Breach Investigations Report)
- The ITRC recorded 1,803 data compromises in the United States during H1 2026, including 1,394 confirmed data breaches. Confirmed breaches represented 77% of all recorded compromise events. (ITRC — H1 2026 Data Breach Report)
- H1 2026 data compromises increased 3.3% from 1,746 in H1 2025 and 14.8% from 1,571 in H1 2024. At that pace, the ITRC projected approximately 3,600 compromises for the full year. (ITRC — H1 2026 Data Breach Report)
- Q2 2026 alone recorded 1,029 data compromises, compared with 774 in Q1, making Q2 the second-highest single quarter in ITRC tracking history. (ITRC — H1 2026 Data Breach Report)
- More than 471.2 million victim notices were issued during the first half of 2026, already exceeding the total issued during the entire previous year. (ITRC — H1 2026 Data Breach Report)
- The Canvas breach alone generated an estimated 275 million victim notices, accounting for 58% of the H1 2026 total. Combined with the Under Armour compromise, the two largest breaches generated approximately 347.7 million notices. (ITRC — H1 2026 Data Breach Report)
- Publicly traded companies accounted for only 185 of 1,803 compromises, or 10.3%, but generated approximately 392.9 million victim notices, representing 83.4% of the H1 2026 total. (ITRC — H1 2026 Data Breach Report)
- Cyberattacks accounted for 1,256 of 1,803 compromises, or 69.7%, but were responsible for approximately 434.8 million victim notices, or 92.3% of all H1 2026 notices. (ITRC — H1 2026 Data Breach Report)
- The United States records 3,321 data compromises in 2025, the highest annual total in the ITRC series. (ITRC H1 2026 Data Breach Report)
Note: ITRC uses “victim notices” as a measure of breach impact. They should not be interpreted as a one-to-one count of unique individuals because one person can receive notices from multiple incidents.
Major Data Breaches and Their Impact
- The ITRC estimates that the 2026 Canvas incident generated approximately 275 million victim notices, representing 58% of all H1 2026 victim notices. Instructure separately confirmed unauthorized activity involving Canvas but has not publicly confirmed the ITRC’s 275 million figure. (ITRC — H1 2026 Data Breach Report; Instructure — Security Incident Update)
- An Under Armour data event resulted in approximately 72.7 million victim notices, making it one of the largest compromises tracked by the ITRC during Q1 2026. (ITRC — Q1 2026 Data Breach Analysis)
- The PowerSchool breach generated approximately 71.9 million victim notices involving students and educators. PowerSchool also offered affected students and educators two years of complimentary identity protection or credit monitoring. (ITRC — 2025 Annual Data Breach Report; Maine Attorney General — PowerSchool Breach Notice)
- The SoundCloud compromise generated approximately 29.8 million victim notices during Q1 2026, making it one of the largest breaches tracked during the quarter. (ITRC — Q1 2026 Data Breach Analysis)
- The CarGurus incident was associated with approximately 12.5 million victim notices. CarGurus later said its investigation found the incident was limited in scope and that dealer data feeds, APIs, and core dealer systems were not compromised. (ITRC — Q1 2026 Data Breach Analysis; CarGurus — Cybersecurity Incident Information)
- Change Healthcare reported that approximately 192.7 million individuals were affected by its cyberattack. The updated figure was provided to the U.S. Department of Health and Human Services in July 2025. (U.S. HHS — Change Healthcare Cybersecurity Incident)
- Australia’s privacy regulator found that approximately 5.67 million Qantas customer records were compromised in the airline’s 2025 cyber incident. Qantas had initially disclosed that the affected third-party platform contained records for around 6 million customers. (OAIC — Report Into the Qantas Cyber Incident; Qantas — Cyber Incident Disclosure)
- A TransUnion breach affected 4,461,511 people, including 16,828 Maine residents. The company offered affected consumers two years of complimentary credit monitoring. (Maine Attorney General — TransUnion Data Breach Notice)
- Marks & Spencer recorded £131.3 million in incident-related costs during its 2025/26 financial year and received £100 million in insurance proceeds related to the cyber incident. (Marks & Spencer — Full Year Results 2026; Marks & Spencer — Cyber Update)
Ransomware Encryption Rates, Recovery Costs, and Timelines by Country
Ransomware outcomes vary sharply across the country reports published in 2026. The same attack can produce very different encryption, identity, recovery-cost, and recovery-time outcomes across markets.
The comparison below uses 17 Sophos country studies conducted from January through March 2026 and covering ransomware incidents from the previous 12 months:
| Country | Data Encrypted | Ransomware Incident Matched Most Significant Identity Attack | Average Recovery Cost | Recovered Within One Week |
| Australia | 64% | 77% | $1.66M | 50% |
| Brazil | 56% | 74% | $1.05M | 58% |
| Chile | 48% | 84% | $1.04M | 44% |
| Colombia | 43% | 50% | $650,510 | 78% |
| France | 60% | 85% | $2.02M | 64% |
| Germany | 45% | 69% | $1.42M | 60% |
| India | 60% | 79% | $1.11M | 58% |
| Italy | 61% | 87% | $2.07M | 64% |
| Japan | 51% | 74% | $1.88M | 52% |
| Mexico | 43% | 67% | $752K | 64% |
| Singapore | 36% | 68% | $1.14M | 48% |
| South Africa | 63% | 85% | $1.08M | 40% |
| Spain | 56% | 73% | $2.28M | 50% |
| Switzerland | 66% | 58% | $2.21M | 59% |
| United Kingdom | 66% | 76% | $1.49M | 55% |
| United Arab Emirates | 38% | 71% | $665,208 | 48% |
| United States | 57% | 69% | $2.51M | 53% |
Among these 17 country studies, Switzerland and the United Kingdom have the highest encryption rate at 66%, while Singapore has the lowest at 36%. The gap shows how the likelihood of encryption differs substantially across the surveyed markets.
Italy has the highest identity overlap at 87%, meaning the ransomware incident matches the organization’s most significant identity attack for nearly nine in ten Italian respondents. France and South Africa each reach 85%, which connects ransomware exposure closely with identity compromise in those markets.
Recovery outcomes diverge just as sharply. Colombia has the highest one-week recovery rate at 78%, while South Africa has the lowest at 40%. The United States carries the highest average recovery cost in this comparison at $2.51 million, followed by Spain at $2.28 million and Switzerland at $2.21 million.
Check Out Our Other Statistical Research Articles:
- 100+ Compliance Statistics
- 280+ Cybersecurity Compliance Stats
- 100+ Penetration Testing Statistics
- 200+ Cybersecurity Statistics
What Do I Do If My Social Security Number Is in a Data Breach?
If your Social Security number appears in a data breach notice, act quickly to limit identity theft, tax fraud, account takeover, and related scams.
Here is a step-by-step process you can follow to protect yourself and limit potential damage:
Step 1: Confirm Which Personal Details Were Exposed
Review the breach notification and confirm whether your Social Security number was actually exposed. Check whether other information was involved as well, such as your date of birth, address, driver’s license number, financial information, or account credentials.
Knowing exactly what was compromised helps you decide which protections are most important.
Step 2: Check Your Credit Reports for Unfamiliar Activity
Review your credit reports from Equifax, Experian, and TransUnion through AnnualCreditReport.com. Consumers can access reports from all three bureaus once a week for free.
Look for accounts, credit inquiries, balances, or addresses you do not recognize. If anything appears suspicious, document it before disputing or reporting it.
Step 3: Freeze Your Credit With All Three Bureaus
Consider placing a credit freeze with Equifax, Experian, and TransUnion. A freeze makes it harder for an identity thief to open new credit accounts in your name.
You must place a freeze separately with each bureau, and it stays in place until you lift it. If you request a lift online or by phone, the bureau generally must process it within one hour.
A fraud alert is another option. Unlike a freeze, you only need to contact one bureau, which will notify the other two. An initial fraud alert lasts one year, while confirmed identity-theft victims can request an extended alert lasting seven years.
Step 4: Report Identity Theft If Your SSN Has Already Been Misused
If you discover that someone has already opened an account, filed a claim, or otherwise used your identity, report it at IdentityTheft.gov or call the FTC at 1-877-438-4338.
IdentityTheft.gov can generate a personalized recovery plan and help you document the identity theft when dealing with creditors, banks, or credit bureaus.
Step 5: Get an IRS Identity Protection PIN
Request an IRS Identity Protection PIN (IP PIN) to help prevent someone from filing a federal tax return using your Social Security number.
An IP PIN is a six-digit number used to verify your identity when filing a tax return. The IRS generates a new IP PIN every year, so you must use the current one for each filing season.
Anyone with an SSN or ITIN who can verify their identity can request one. If you cannot complete online verification, some taxpayers can use Form 15227, while others can make an appointment at an IRS Taxpayer Assistance Center.
Step 6: Review and Protect Your Social Security Record
Sign in to your personal my Social Security account and review your earnings history and benefit information.
If you see wages or activity that do not belong to you, request a correction through Social Security or contact your local SSA office.
The Social Security Administration can also place a block on electronic access to your record when appropriate. Be aware that this also blocks your own electronic access until you verify your identity and have the restriction removed.
Step 7: Consider myE-Verify Self Lock
If you are concerned that someone may use your Social Security number for employment-related fraud, consider using myE-Verify Self Lock.
Self Lock can prevent your SSN from being successfully used in an E-Verify employment eligibility check while the lock is active. It is specific to E-Verify, so it does not prevent every possible form of employment or identity fraud.
Step 8: Use Any Free Credit Monitoring Offered After the Breach
If the breached organization offers free credit monitoring, identity monitoring, or identity theft insurance, consider enrolling.
These services can alert you to suspicious activity, but they do not replace a credit freeze. Monitoring tells you when something may have happened; a freeze helps prevent certain types of new-account fraud in the first place.
Step 9: Monitor Existing Accounts and Watch for Scams
A credit freeze does not protect accounts you already have, so continue reviewing your bank accounts, credit cards, tax records, and benefit accounts for unusual activity.
Use unique passwords, enable multi-factor authentication on important accounts, and do not routinely carry your Social Security card.
Also be cautious of unexpected calls, texts, or emails claiming to be from the Social Security Administration, IRS, a bank, or a credit bureau. Verify suspicious messages through the organization’s official website or account portal instead of using links or phone numbers provided in the message.
How Do You Prepare for Data Breaches in 2026?
Preparing for data breaches can be difficult as AI-driven attacks and other attack methods evolve. This analysis-driven section gives you a way forward. The following eight priorities address the attack patterns creating the greatest breach exposure in 2026:
1. Prioritize Exploited Vulnerabilities
Vulnerability exploitation accounts for 31% of initial access in applicable breaches, making it the leading entry method. At the same time, only 26% of known exploited vulnerabilities identified in organizations receive full remediation, and median remediation time has increased to 43 days.
What to do:
- Prioritize vulnerabilities that attackers actively exploit.
- Identify every internet-facing system affected by critical vulnerabilities.
- Assign an owner and remediation deadline to each finding.
- Use penetration testing to identify attack paths that automated scanners miss.
- Retest vulnerabilities after remediation to confirm the fix works.
- Include older vulnerabilities instead of focusing only on newly disclosed flaws.
2. Strengthen Identity and Access Controls
Credential abuse appears somewhere in the attack progression in 39% of breaches. Identity-driven techniques account for 65% of initial access in Unit 42 incident-response cases, showing how frequently attackers rely on legitimate accounts rather than malware alone.
What to do:
- Require multi-factor authentication for privileged and remote access.
- Use phishing-resistant MFA for administrators and other high-risk accounts.
- Apply least-privilege access to employees, vendors, and service accounts.
- Remove dormant accounts and unnecessary administrator privileges.
- Rotate exposed credentials, API keys, and authentication tokens.
- Review privileged access regularly instead of waiting for an annual audit.
3. Control AI and Shadow AI Usage
Among organizations experiencing an AI-related breach, 92% lack proper AI access controls. Shadow AI incidents have increased to 43%, while breaches involving shadow AI average $5.39 million.
What to do:
- Maintain an inventory of approved AI applications and models.
- Assign a business owner to every approved AI tool.
- Restrict employees from entering sensitive data into unapproved AI services.
- Review AI plugins, APIs, OAuth grants, and data-store connections.
- Apply role-based access controls to AI service accounts and agents.
- Audit for unsanctioned AI use and include AI risks in employee training.
- Define which data employees can and cannot process through AI systems.
4. Strengthen Vendor and Application Security
Third parties are involved in 48% of data breaches, up from 30% in the previous dataset. Only 23% of third-party organizations fully remediate missing or improperly configured MFA on cloud accounts, leaving persistent access risks outside the organization’s direct environment.
What to do:
- Tier vendors based on their access to sensitive systems and data.
- Require MFA for external administrative access.
- Review vendor permissions before onboarding and throughout the relationship.
- Remove unused OAuth connections, API keys, and integration tokens.
- Include breach-notification deadlines in high-risk vendor contracts.
- Include critical suppliers in incident-response and recovery exercises.
- Revoke vendor access immediately when a contract or business need ends.
5. Train Employees for Multichannel Social Engineering
The human element appears in 62% of data breaches, while 41% of social engineering breaches involve at least one channel other than email. Phone calls, text messages, social media, help-desk impersonation, and MFA fatigue now require the same attention as traditional phishing.
What to do:
- Run phishing, phone, and SMS simulations throughout the year.
- Require independent verification for payment-detail changes.
- Use a separate communication channel to verify MFA-reset requests.
- Train help-desk employees to identify impersonation attempts.
- Teach employees to report suspicious requests immediately.
- Measure reporting speed as well as simulation failure rates.
- Give finance and privileged users additional role-specific training.
6. Connect Monitoring Across Every Environment
Breaches involving data distributed across on-premises, private-cloud, and public-cloud environments take an average of 256 days to identify and contain. Organizations extensively using security AI and automation reduce the average lifecycle to 215 days, compared with 280 days for organizations using neither.
What to do:
- Centralize logs from cloud, SaaS, endpoints, applications, and on-premises infrastructure.
- Apply the same privileged-access standards across environments.
- Monitor authentication activity and unusual privilege changes.
- Connect alerts so analysts can follow activity across multiple systems.
- Use automation for repetitive triage and evidence collection.
- Require human approval before automated tools isolate critical production systems.
- Test monitoring coverage whenever a new service enters production.
7. Rehearse Incident Response Before an Attack
The fastest 25% of intrusions reach confirmed data theft within 72 minutes, while average eCrime breakout time has fallen to 29 minutes. Security teams may have minutes rather than hours to make containment decisions once an attacker gains access.
What to do:
- Run ransomware and data-theft tabletop exercises at least twice a year.
- Define who has authority to isolate compromised systems.
- Give responders standing permission to revoke malicious sessions.
- Establish clear escalation triggers for executives, legal teams, and communications staff.
- Maintain current contact information for internal and external responders.
- Practice scenarios involving compromised administrator accounts and stolen data.
- Update the incident-response plan after every exercise or real incident.
8. Test Backups and Recovery
Backup systems suffer an impact in 26% of extortion cases, while 58% of breached organizations have not yet fully recovered. Among organizations that complete recovery, 19% take more than 150 days.
What to do:
- Keep recovery copies isolated from production administration.
- Protect backup accounts with phishing-resistant MFA.
- Maintain immutable or otherwise protected backup copies.
- Restore critical systems during scheduled recovery tests.
- Record how long each restoration takes.
- Define the restoration order for identity systems, applications, and dependent services.
- Verify that recovered systems no longer contain attacker access.
- Include stolen-data exposure, legal review, notifications, and communications in the recovery plan.
Data breach preparation works best when these controls operate together. Vulnerability management reduces opportunities for initial access, identity controls limit attacker movement, monitoring shortens detection time, and tested incident-response and recovery plans reduce the damage when prevention fails.
Did you know most companies struggle with cybersecurity compliance? Explore 150 compliance stats that reveal the biggest challenges and trends.
Data Breach Trends in 2026
Data breaches in 2026 exploit old software flaws, trusted access, connected applications, and weak AI account security. Disrupted backups delay recovery, and business losses continue after systems are restored.
The six trends below explain how these risks affect your organization and where to focus your defenses:
1. Older Software Flaws Remain a Threat
Older software flaws remain useful to attackers. In the 2026 dataset, 80% of persistently exploited vulnerabilities date from before 2024. Across the full category, exploitation occurs on an average of 96% of monitored days.
Security teams need to prioritize flaws that attackers actively exploit and check which systems remain exposed.
2. Attackers Misuse Remote Support Tools
Attackers trick employees into granting access through legitimate remote support tools. In a 2025 attack at a U.S. law firm, an employee grants access through Microsoft Quick Assist. The attacker attempts to transfer files within four minutes.
A firewall blocks the first transfer, and the attacker switches to Google Drive. Defenders stop the activity before the transfer completes, showing why monitoring must continue after an initial attempt fails.
3. Untracked App Connections Leave Data Exposed
Third-party app connections can retain access after employees leave or teams stop using them. A review after a Salesforce incident reveals nearly 100 additional connections. Some are unused, unmonitored, or tied to former employees.
Attackers use stolen OAuth tokens, digital credentials that let connected apps access systems and data. Security teams need to check what each app can read or change and remove access that is no longer needed.
4. AI Accounts Have Gaps in Access Protection
AI tools use non-human identities, such as service accounts, to access systems and data. The AI and automation section distinguishes protection for these identities from broader AI access-control coverage.
Role-based access controls limit service-account permissions based on assigned roles. An AI tool that only reads customer records does not need permission to delete them.
5. Attackers Disrupt Backups and Recovery
Attackers can interfere with backup systems during extortion cases, making it harder to restore data and resume operations. The ransomware section above provides the relevant incident-response measure.
Recovery requires teams to rebuild compromised systems and stop any remaining attacker access. Attackers can continue threatening to publish stolen data after services return.
6. Lost Business Raises Breach Costs
Average lost-business costs reach $1.54 million in the 2026 breach cost data, up from $1.38 million a year earlier. These costs include revenue lost during downtime, customer losses, and the expense of gaining replacement customers.
The financial damage can continue after systems return. Customers who switch providers during an outage may never come back.
How Can Bright Defense Help Prevent Data Breaches?
Bright Defense helps organizations reduce breach risk through penetration testing, continuous compliance, vulnerability management, vCISO support, and incident-response planning. These services identify attack paths, prioritize remediation, strengthen governance and access controls, and prepare teams to contain threats before they create avoidable operational or data exposure.
These services expose attack paths, track remediation, strengthen access controls, and prepare security teams to respond when a breach threatens production systems or sensitive data.
Penetration Testing Services test applications, APIs, cloud environments, and networks for exploitable weaknesses, then verify fixes through retesting.
Continuous Cybersecurity Compliance keeps security controls and remediation work active throughout the year. A virtual chief information security officer (vCISO) provides senior security leadership for strategy, risk decisions, compliance, and incident planning.
FAQ
1. Are Data Breaches Increasing Year Over Year?
Yes. U.S. data compromise volume continues to rise. The latest ITRC data puts 2026 on pace to exceed the 3,321 compromises used as the 2025 benchmark in its H1 2026 analysis. The earlier 2025 annual release recorded a 5% year-over-year increase from 2024.
2. What Is the Average Cost of a Data Breach?
The global average cost of a data breach is $4.99 million in 2026, up 12% from the previous year. U.S. organizations face the highest average cost at $11.5 million. Detection, escalation, lost business, recovery work, legal expenses, and regulatory costs all contribute to the total.
3. What Is the Biggest Data Breach in History?
The Yahoo breach is generally considered the largest publicly disclosed data breach by number of accounts affected. The August 2013 breach ultimately affected all approximately 3 billion Yahoo accounts that existed at the time.
4. Which Country Has the Most Data Breaches?
The United States has the highest total in recent breached-account datasets. In 2025, 142.9 million U.S. accounts were compromised, more than one-third of breached accounts recorded globally in that dataset. Country rankings vary because breach disclosure laws, data collection methods, and the definition of a breach differ between studies.
5. What Are the Most Common Causes of Data Breaches?
Common breach entry points include exploited software vulnerabilities, phishing, stolen credentials, social engineering, misconfigurations, insider activity, and third-party compromise. In the Verizon 2026 DBIR, vulnerability exploitation leads known initial access vectors at 31%, followed by phishing at 16% and credential abuse at 13%.
6. What Is the Biggest Cause of Breaches?
Vulnerability exploitation is the leading initial access vector in the Verizon 2026 breach dataset, accounting for 31% of breaches. Attackers frequently target known flaws in internet-facing software, edge devices, applications, and other exposed systems.
7. What Is the Most Common Source of Data Breaches?
External attackers are the dominant source of data breaches. External actors are involved in 88% of breaches in the Verizon 2026 DBIR, compared with 12% involving internal actors. Organized criminal groups make up the largest share of external attackers.
When “source” refers to the way attackers first enter an environment, vulnerability exploitation is the leading initial access vector.
8. What Types of Data Are Most Often Exposed in Breaches?
Internal business data is the most frequently compromised data type, appearing in 67% of breaches in the Verizon 2026 dataset. Credentials appear in 28%, personal information in 23%, and sensitive personal information such as Social Security numbers in 1.7%. Internal data includes material such as emails, plans, reports, and other non-public business information.
9. How Does the Number of Data Breaches in the Healthcare Sector Compare With Other Sectors?
Healthcare remains one of the most frequently breached sectors, but it does not rank first in current U.S. data. Healthcare records 281 compromises in H1 2026, second to financial services at 387. Healthcare was second in 2025 as well, with 534 compromises compared with 739 in financial services.
10. Why Are There More Data Breaches in the Healthcare Sector Than in Many Other Sectors?
Healthcare organizations hold large amounts of sensitive health and identity information while depending on interconnected technology to provide time-sensitive care. Hospitals, insurers, laboratories, service providers, medical devices, cloud platforms, and third-party systems create numerous access points.
Healthcare organizations have limited tolerance for prolonged outages because disrupted systems can affect patient care. This combination of valuable data, technological dependence, connected vendors, and operational urgency makes the sector an attractive target for ransomware and data theft. HHS describes healthcare as particularly vulnerable because of its sensitive data, technology dependence, size, and vulnerability to disruption.
11. Can Small Businesses Recover From Data Breaches?
Yes. Small businesses can recover from data breaches, but recovery depends heavily on preparation before the incident. Tested backups, an incident-response plan, cyber insurance where appropriate, documented recovery priorities, access controls, and outside technical or legal support can reduce disruption.
NIST provides small-business guidance specifically for preparing for, responding to, and recovering from cyber incidents.
12. How Can You Prevent a Data Breach?
Data breach prevention requires reducing the number of opportunities an attacker has to gain access and limiting what a compromised account or system can reach. Organizations need current software, strong authentication, restricted privileges, protected backups, employee training, continuous monitoring, vendor controls, and a tested incident-response process.
13. What Are Eight Ways to Prevent Data Breaches?
Eight practical ways to reduce data breach risk are:
- Patch operating systems, applications, and internet-facing devices quickly.
- Require phishing-resistant MFA for privileged and sensitive accounts.
- Apply least-privilege access so users and services receive only the permissions they need.
- Maintain regular backups and test that critical systems can be restored.
- Train employees to recognize phishing, impersonation, and fraudulent access requests.
- Monitor endpoints, networks, cloud services, and authentication activity for suspicious behavior.
- Review third-party access, API connections, service accounts, and vendor permissions regularly.
- Maintain and rehearse an incident-response plan with clear containment and recovery responsibilities.
NIST and CISA guidance supports these controls, including phishing-resistant MFA, patching, tested backups, account reviews, least privilege, and incident-response preparation.
14. What Trends Are Shaping the Future of Data Breaches?
AI, vulnerability exploitation, identity attacks, third-party exposure, ransomware, mobile-focused social engineering, insider threats, and declining breach transparency are shaping the next phase of data breaches.
AI creates risk on both sides. Attackers can use it to accelerate reconnaissance, impersonation, phishing, and malware development, while organizations are putting more controls around their own AI systems. The share of organizations assessing AI security rose from 37% in 2025 to 64% in 2026.
Software vulnerabilities are becoming more important as an entry point, ransomware remains involved in 48% of breaches in Verizon’s dataset, and third-party exposure continues to expand attack paths. Public breach information is becoming less transparent as well. Only 24% of breach notices tracked by the ITRC in H1 2026 disclosed the attack vector.