350+ Cybersecurity Compliance Statistics – June 2026

Updated:
July 14, 2026
Cybersecurity compliance has become a critical business requirement for organizations across every industry. Security leaders, compliance professionals, IT teams, healthcare organizations, government contractors, and business executives rely on compliance frameworks to manage risk, meet regulatory requirements, and build customer trust.
To help readers stay informed, the team at Bright Defense compiled the latest cybersecurity compliance statistics and trends in 2026.
In this article, you’ll find insightful statistics about:
- Cybersecurity Compliance and Governance Statistics
- SOC 2 Compliance
- CMMC Compliance
- HIPAA Compliance
Without further ado, let’s see the stats!
Audit and Compliance Management Statistics
- A-LIGN 2026 reports that 80% rate compliance report quality as extremely important, 83% notice quality differences between auditors, and 60% would switch auditors to improve final report quality. (A‑Lign – 2026 Compliance Benchmark Report)
- A-LIGN 2026 says more than half of respondents have had a vendor or prospect reject a report, with missing documentation, weak control testing, templated reports, and lack of auditor trust among the reasons. (A‑Lign Compliance Benchmark 2024)
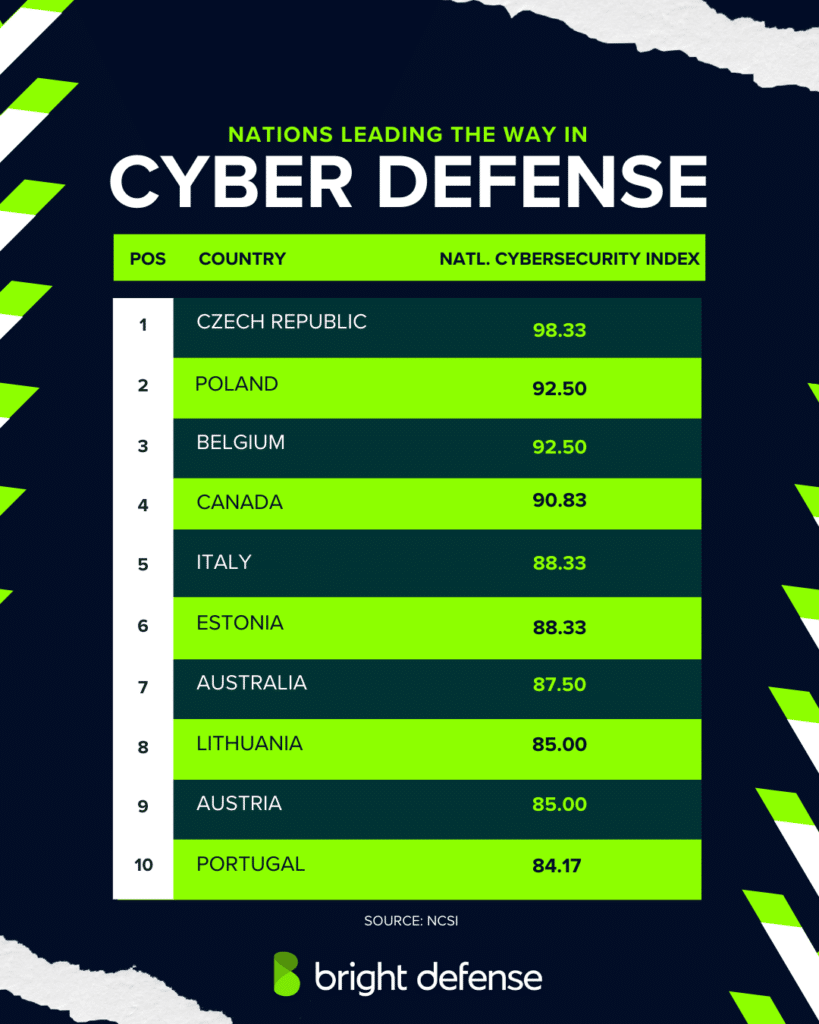
- According to a 2025 research, the Czech Republic has the highest National Cyber Security Index (NCSI) score at 98.33, followed by Poland and Belgium at 92.50, and Estonia at 88.33. (NCSI)
- Haiti and the Solomon Islands have the lowest National Cyber Security Index (NCSI) scores at 4.17, followed by Micronesia at 5.83 and Iraq at 10.00. (NCSI)
- 34% lost business because they were missing a required certification, up from 29% the previous year. (A‑Lign Compliance Benchmark 2024)
- 83% conduct multiple audits separately each year, which duplicates evidence and effort. (A‑Lign Compliance Benchmark 2024)
- Nearly 80% of respondents use more than one auditor, adding complexity and cost. (A‑Lign Compliance Benchmark 2024)
- When choosing an auditor, companies prioritize an experienced team (32%), high report quality (22%) and technology‑driven audits (19%). (A‑Lign Compliance Benchmark 2024)
- Only 20% of organizations maintain a dedicated compliance department. (A‑Lign Compliance Benchmark 2024)
- 66% of compliance teams spend three or more months each year on audits. (A‑Lign Compliance Benchmark 2024)
- A-LIGN 2026 reports that 99% believe consolidating or harmonizing audits could save time or money, while 27% say the main barrier is not knowing where to start. (A‑Lign – 2026 Compliance Benchmark Report)
- 83% have completed vendor security questionnaires, showing that supplier risk assessments are common. (A‑Lign Compliance Benchmark 2024)
- 47% fill out 11 or more questionnaires per year; most spend around two hours per questionnaire. (A‑Lign Compliance Benchmark 2024).
- 95% use technology during audits or assessments, 96% believe audit or GRC technology produces a better audit, and more than 85% use a solution provided through a readiness partner or audit team. (A‑Lign – 2026 Compliance Benchmark Report)
- 15% face coordination problems due to multiple auditors with different workflows. (A‑Lign Compliance Benchmark 2024)
- 25% say auditors react to client demands instead of matching internal priorities. (A‑Lign Compliance Benchmark 2024)
- 17% admit their compliance programs lag behind technological change. (A‑Lign Compliance Benchmark 2024)
- Another 17% say they cannot keep up with evolving requirements. (A‑Lign Compliance Benchmark 2024)
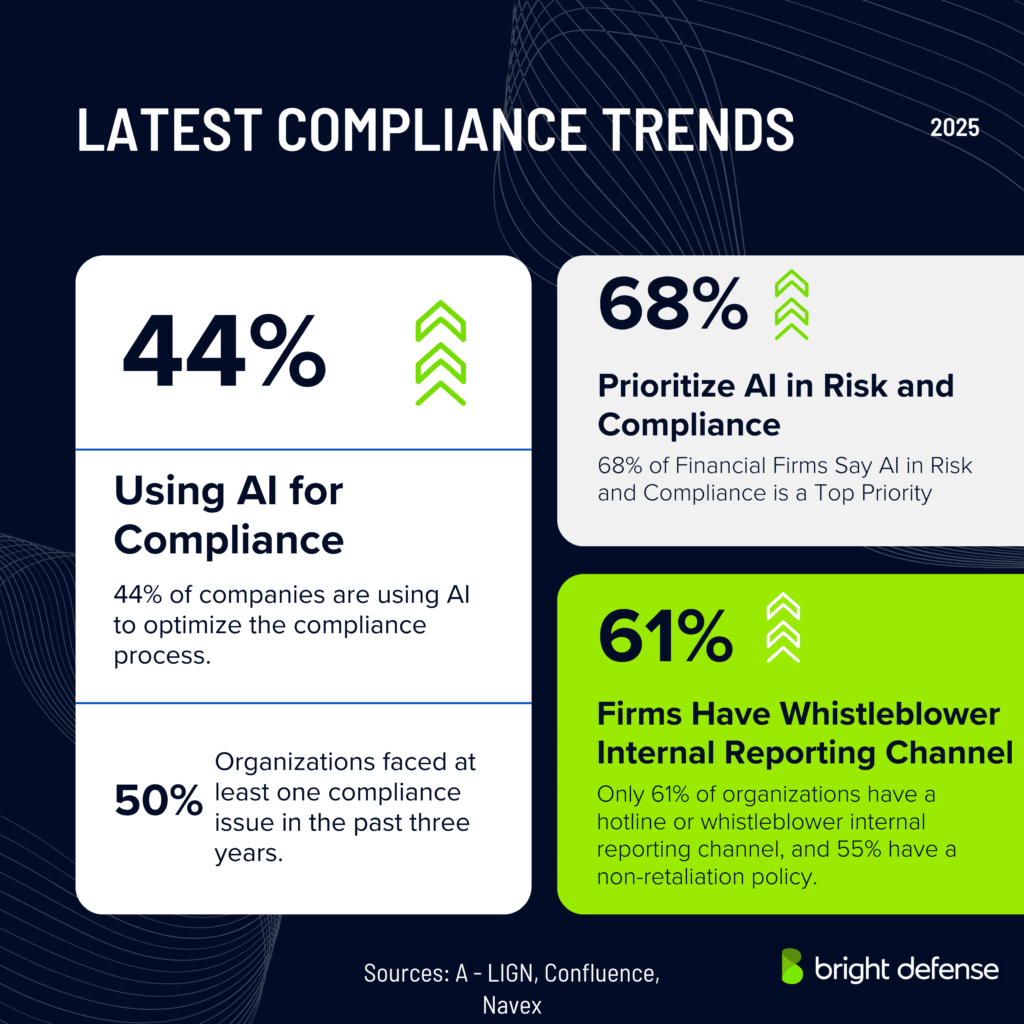
- 61% of firms have a whistleblower internal reporting channel and 55% have a non‑retaliation policy. (NAVEX State of Risk & Compliance Report)
- Nearly 60% of small businesses that suffer a cyber attack are unable to recover, often closing within six months of the incident. (MSSP Alert).
- 45% of organizations would switch audit providers for more efficient processes . (A‑Lign Compliance Benchmark 2024)
- Approximately 77% of IT security professionals report an uptick in attempted network intrusions (World Economic Forum).
- Cyberattacks and breaches are projected to cost the global economy $10.5 trillion annually by 2025 (Cybercrime Magazine).
- 50% of organizations faced at least one compliance issue in the past three years, and 37% experienced more than one. (NAVEX State of Risk & Compliance Report)
- 16% of organizations lack a hotline or whistleblower internal reporting channel (NAVEX).
- 77% of employees say they would report misconduct internally, while 14% would report to external entities and 9% would not report at all. (NAVEX State of Risk & Compliance Report 24)
- The average cost per data breach for businesses with fewer than 500 employees was $3.31 million in 2023 (IBM).
- Ransomware could cause annual damages of up to $265 billion (Infosec), and recovering from a ransomware attack now costs $2.73 million (Sophos).
- Over 700,000 cyber attacks against small businesses caused total damages of $2.8 billion (Strong DM).
- The total addressable cybersecurity market is between $1.5 trillion and $2 trillion annually (McKinsey).
- 91% of companies plan to implement continuous compliance in the next five years (Drata).
- 52% cite compliance certification as a top‑three priority for maintaining security (Vanta).
- On average, it takes about 207 days to detect a breach, giving attackers ample time to cause damage (Statista).
- 80% of organizations plan to increase spending on cybersecurity measures in 2024 (Forcepoint).
- 41% of companies lack the tools to enforce policies required to achieve compliance (JumpCloud).
- About 70% of organizations report that their employees lack essential cybersecurity knowledge, an increase from 56% in 2023. (Fortinet).
- The industry still faces a shortage of skilled cybersecurity professionals; if unaddressed, this gap could expand to 85 million by 2030 (SentinelOne).
- 80% of organizations had at least one employee fall victim to a phishing attempt (Fortinet).
- The percentage of organizations achieving basic cyber resilience has dropped by about 30%. (SentinelOne)
82% of breaches involved data stored in the cloud (IBM). - Advances in generative AI could reduce the need for specialized expertise in nearly 50% of entry‑level cybersecurity roles by 2028. (SentinelOne)
- In 2025, EU regulators issued a €530 million penalty, one of the largest of the year, illustrating the severe financial consequences of failing to comply with data protection laws. (Irish Data Protection Commission)
- Ransomware now accounts for 35% of all cyberattacks, an 84% increase from the previous year. (SentinelOne).
- 58% of organizations say employees ignore their cybersecurity policies. (Try Hack Me)
- Nearly nine in ten financial services executives worldwide (89 percent) expect compliance department costs to keep rising over the next two years. (Accenture)
- 69% say regulatory compliance is the primary security spending driver (TechBeacon).
- The total addressable governance, risk and compliance market is estimated at $50 billion to $100 billion (McKinsey).
- 44% of organizations say that risk assessment and audit are the biggest cloud compliance challenges (Accenture).
- The global enterprise governance, risk and compliance market was valued at $47.22 billion in 2022 and is projected to grow at a compound annual rate of 13.8% through 2030. (Grand View Research)
- The small to medium enterprise segment is expected to have the highest growth rate of any segment in the eGRC space. (Grand View Research)
- 57% of startups have no security roadmap. (Vanta)
- More than 75% of organizations lack visibility into their IT assets. (JumpCloud)
- 50% of small businesses have no cybersecurity measures in place (We Know Cyber).
- New data shows 90% of cyber leaders say risk management has become more difficult, burnout is rising, and only 17% have full visibility into threats. (Bit Sight)
- Although 48% of SMBs have faced a cyberattack, 43% still struggle to determine what level of security they actually need. (TechTarget)
- North America accounted for 34% of global eGRC revenue in 2022. (Grand View Research).
- 66% of companies say that compliance mandates drive spending. (Varonis)
- 83% say complex, interconnected risks are emerging more rapidly. (Accenture – Risk Study 2025)
- 81% say risks in other sectors now affect their business. (Accenture – Risk Study 2025)
- 77% say risks are harder to detect and manage. (Accenture – Risk Study 2025)
- 72% say their risk capabilities have not kept pace with the changing environment. (Accenture – Risk Study 2025)
- 49% of software and platforms respondents say disruptive tech risks rose most since 2021. (Accenture – Risk Study 2025)
- 41% of retail respondents say social change poses a high risk. (Accenture – Risk Study 2025)
- 40% of utilities respondents say third-party risks rose most since 2021. (Accenture – Risk Study 2025)
- 42% of telecom respondents see net-neutrality regulatory changes as a significant risk to future success. (Accenture – Risk Study 2025)
- Vanta October 2025 reports that teams now spend 12 weeks per year on compliance and 9 working weeks per year on vendor reviews. It reports that 61% spend more time proving security than improving it, and 64% say security frameworks feel like security theater. (Vanta – State of Trust)
- 9% spend more than 21 hours each week on security compliance, about 25 working weeks a year. (Vanta – State of Trust)
- UK average, 12 working weeks on compliance. (Vanta – State of Trust)
- Vendor risk work, 6.5 hours per week on average, equal to 7.6 working weeks per year. (Vanta – State of Trust)
- 59% say automating manual work is a priority in security and compliance strategy. (Vanta – State of Trust)
- 44% increased investment in security automation in the past year. (Vanta – State of Trust)
- Teams could save about 10% of the working week. (Vanta – State of Trust)
- Estimated hours saved per week with automation:
- Audit evidence collection, 4.6 hours then 3.8 hours
- Security questionnaires, 4.0 then 3.1
- Tracking regulatory updates, 3.6 then 4.2
- Offboarding, 3.8 then 2.9
- Finding shadow vendors and apps, 4.1 then 3.4 (Vanta – State of Trust)
- 68% of compliance leaders use automated tools for evidence collection. (Hyperproof – IT Risk and Compliance Report)
- 47% of organizations rely on governance, risk, and compliance management platforms, a 12% increase from 2024. (Hyperproof – IT Risk and Compliance Report)
- 27% of organizations have fully automated their control testing workflows. (Hyperproof – IT Risk and Compliance Report)
- 58% of compliance teams cite manual evidence collection as their biggest challenge. (Hyperproof – IT Risk and Compliance Report)
- 47% of organizations report a shortage of resources within compliance teams. (Hyperproof – IT Risk and Compliance Report)
- 39% of compliance professionals find it difficult to interpret changing regulations. (Hyperproof – IT Risk and Compliance Report)
- 31% of organizations experience audit fatigue due to overlapping frameworks. (Hyperproof – IT Risk and Compliance Report)
- 88% of C-suite respondents view compliance programs as a strategic advantage, while 47% still describe compliance as a “necessary evil.” (NAVEX 2026 State of Risk & Compliance Report)
- 58% of companies that experienced a breach expect to spend more time on IT risk management and compliance in 2026. (Hyperproof 2026 IT Risk and Compliance Benchmark Report)
- 34% of respondents still use spreadsheets to manage third-party risks. (Hyperproof 2026 IT Risk and Compliance Benchmark Report)
- 76% of risk and compliance teams spend at least 30% of their time on repetitive administrative tasks. (Hyperproof 2026 IT Risk and Compliance Benchmark Report)
- GDPR fines reached €97.29 million in the first half of 2022, which supports “nearly €100 million” rather than “nearly $100 million.” Source: S News coverage of Atlas VPN analysis using Enforcement Tracker data. (S News S.r.l.)
- The exact “employees are overly confident” wording is not the strongest match. A source-backed version is that 93% of cybersecurity and IT professionals said they were somewhat or very confident in their ability to manage risk. Source: Bitdefender Cybersecurity Perception Gap. (Bitdefender)
- 70% of breached organizations reported significant or very significant disruption from a breach. Source: IBM Cost of a Data Breach Report 2024 press release. (IBM Newsroom)
- The global average cost of a data breach rose 10% year over year to $4.88 million in 2024. Source: IBM analysis of the Cost of a Data Breach Report 2024. (IBM)
- Organizations took an average of 277 days to identify and contain a breach in 2022. Source: IBM Cost of a Data Breach Report 2022 PDF copy. (cybernetsecurity.com)
- GDPR noncompliance fines hit nearly $100 million in 2022.
- 93% of employees are overly confident about cyber preparedness.
- 62% of managers identify AI-driven attacks as their biggest compliance and defense challenge.
- 70% of breached organizations suffer significant business disruption.
- The global average cost of a data breach rose 10% year-over-year to $4.88 million.
- Security teams take an average of 277 days to identify and contain a data breach.
Our latest compliance news tracks ongoing cases from OCR, FTC, SEC, and CISA throughout 2025 and 2026.
Compliance Audit Frequency Statistics
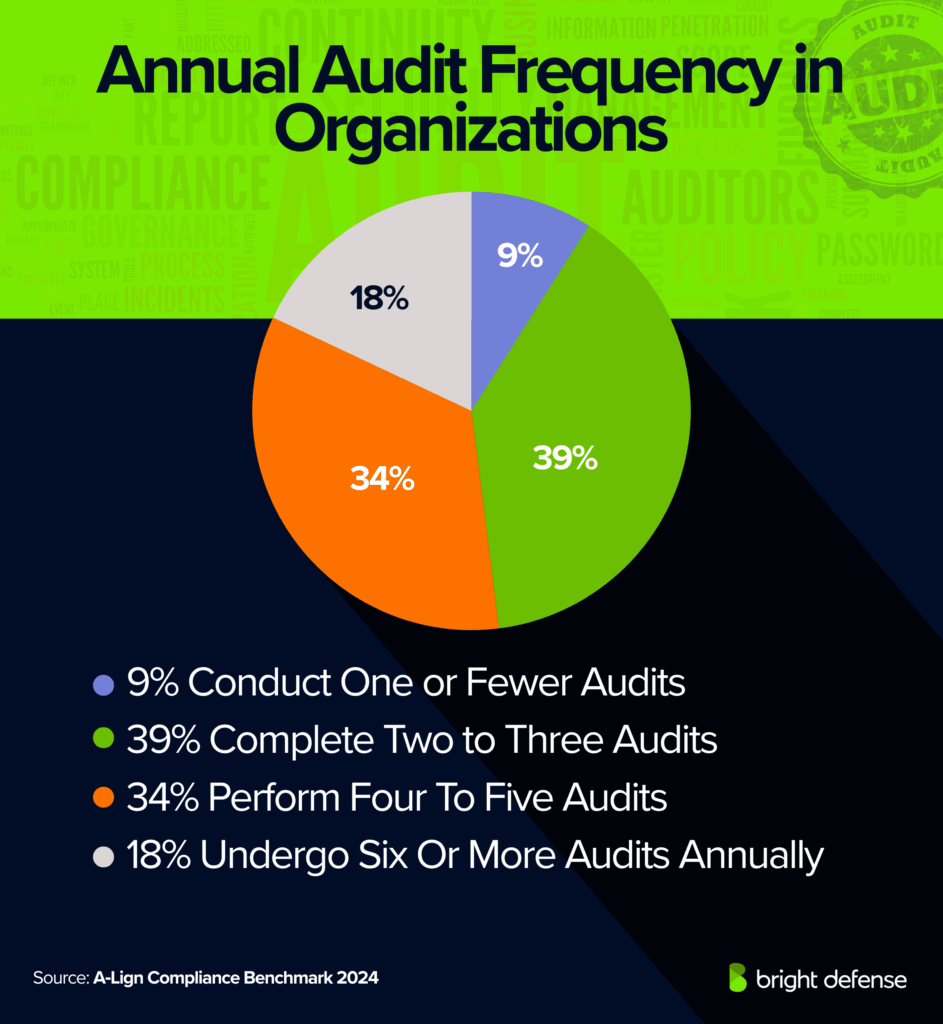
- Frequency of audits: 9% conduct one or fewer audits per year, 39% complete two to three audits, 34% perform four to five audits, and 18% undergo six or more audits annually (A‑Lign Compliance Benchmark 2024)
- Number of auditors used: 21% use zero or one auditor, 44% use two to three auditors, 27% use four to five and 8% rely on six or more auditors(A‑Lign Compliance Benchmark 2024)
- Audit volume: A-LIGN 2026 reports that 97% conduct at least 2 audits per year, 74% of enterprise organizations conduct 4+ audits per year, and 90% work with multiple audit partners.(A‑Lign Compliance Benchmark 2024)
- Audit report quality importance (2025): 70% of respondents rated audit report quality as extremely important to their compliance programs (A‑Lign Compliance Benchmark 2024)
- Most common audits: SOC 2 (76%), penetration testing (74%), SOC 1 (70%), ISO 27001 (67%) and HIPAA (63%) are the most common frameworks used (A‑Lign Compliance Benchmark 2024)
- Most impactful audit: SOC 2 is considered the most impactful certification by 35% of respondents. (A‑Lign Compliance Benchmark 2024)
- Preparation time: 56% spend three to six months preparing for audits, 34% complete prep in one to two months and 10% take more than six months. (A‑Lign Compliance Benchmark 2024)
- Audit spending levels: 16% spend less than $50k annually on audits, 27% spend $50k–$100k, 37% spend $100k–$200k and 20% spend over $200k per year. (A‑Lign Compliance Benchmark 2024)
- Small firm spending: In firms with fewer than 100 employees, 53% spend under $50k per year on audits. (A‑Lign Compliance Benchmark 2024)
- Mid‑sized firm spending: For firms with 100–1,000 employees, 42% spend between $100k and $200k.(A‑Lign Compliance Benchmark 2024)
- Large firm spending: Among firms with over 1,000 employees, 40% spend $100k–$200k and 36% spend over $200k.(A‑Lign Compliance Benchmark 2024)
- Report length vs. quality: When defining a high‑quality audit report, 36% emphasize the number of controls tested and 26% cite the length of the report. (A‑Lign Compliance Benchmark 2025)
- Number of audits and revenue: Organizations with revenue less than $5 million most commonly perform two to three audits, while organizations with revenue above $1 billion perform six or more audits per year. (A‑Lign Compliance Benchmark 2025)
- Enterprise audit spending: 71% of enterprise organizations spend over $100,000 per year on audits. (A‑Lign Compliance Benchmark 2025)
- Small business audit challenge: Budget constraints are the greatest challenge for 21% of small businesses but only 8% of enterprise organizations. (A‑Lign Compliance Benchmark 2025)
- Preparation duration: 37% of organizations spend one to two months preparing for audits each year, and 53% spend three to six months. (A‑Lign Compliance Benchmark 2025)
- Public sector contract requirements: 57% of government‑affiliated organizations conduct audits specifically to meet contract requirements, up from 40% the previous year. (A‑Lign Compliance Benchmark 2025)
- Audits by industry: SOC 1, ISO 27001 and penetration testing are often regarded as the most important audits for businesses. (A‑Lign Compliance Benchmark 2025)
- ISO 27001 adoption and SOC 2 baseline: Current or planned ISO 27001 certifications increased by more than 20% year over year, reaching 81% adoption. SOC 2 is now viewed as a baseline expectation rather than a competitive differentiator. (A‑Lign Compliance Benchmark 2025)
- Organizations with a dedicated security budget reporting “at least monthly”:
- User access reviews, 68% vs 39% without a budget.
- Reviewing overall security posture, 64% vs 31%.
- Vendor security reviews, 65% vs 36%.
- Reviewing security maturity, 65% vs 34%.
- Risk assessments, 70% vs 42%. (Vanta – State of Trust)
- The average annual audit preparation cost per organization is 210,000 dollars. (Hyperproof – IT Risk and Compliance Report)
AI in Compliance Statistics
- 68% of Financial Firms Say AI in Risk and Compliance is a Top Priority (Confluence )
- AI tools for compliance workflows: 44% already use AI tools to manage or improve compliance workflows. (A‑Lign Compliance Benchmark 2024)
- 94% of World Economic Forum survey respondents expect AI to be the most significant driver of cybersecurity change in the next year. (World Economic Forum Global Cybersecurity Outlook 2026)
- Automation cuts manual audit preparation time by 41%.
- 95% report gains from AI or automation, with 1 in 2 seeing better accuracy and faster assessments. (Vanta State of Trust Report)
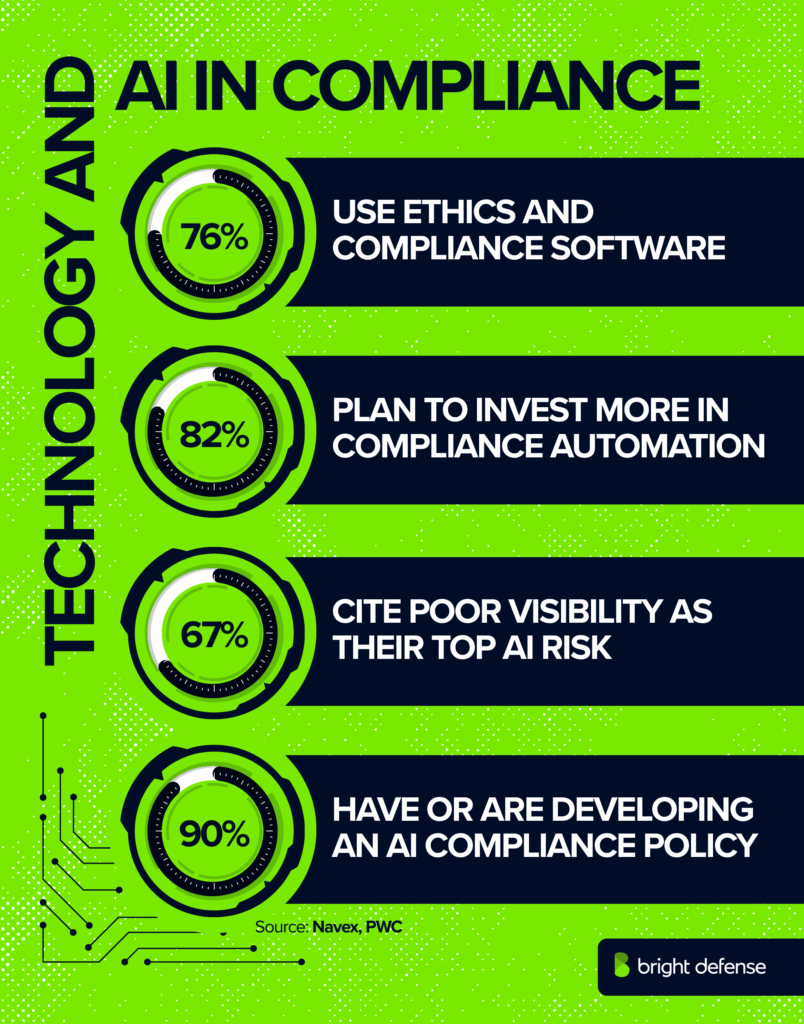
- AI audit policy adoption: 90% of organizations have an AI compliance policy or are developing one. (A‑Lign Compliance Benchmark 2025)
- Concerns about AI’s regulatory impact: A-LIGN 2026 reports that 72% are concerned about AI’s effect on compliance, 77% plan an AI certification in the next 12 months, and 85% plan one in the next 24 months. It lists ISO 42001 at 60%, integrated controls at 56%, and self-assessments at 50% among planned standards. (A‑Lign – 2026 Compliance Benchmark Report)
- Software firms leading AI compliance: 61% of software firms expect to adopt AI compliance standards within the next year. (A‑Lign Compliance Benchmark 2025)
- Planned AI frameworks: Planned AI compliance frameworks include HITRUST AI Risk Management Assessment (45%) and ISO 42001 (43%). (A‑Lign Compliance Benchmark 2025)
- 54% of organizations report that AI-assisted documentation increases audit efficiency. (Hyperproof – IT Risk and Compliance Report)
- Importance of AI auditors: 83% of companies say it is important for auditors to use AI in their audit process. (CFO Brew)
- Positive impact of AI: 71% believe artificial intelligence will have a net positive impact on compliance management. (PwC Global Compliance Survey 2025)
- 37% conduct regular AI risk assessments. (Vanta – State of Trust)
- 36% have or are implementing a company AI policy (42% in the UK, 28% in Australia). (Vanta – State of Trust)
- 22% of compliance teams have minimal or no involvement in AI decision-making, down from 28% in 2025. (NAVEX 2026 State of Risk & Compliance Report)
- 38% of compliance teams are very involved in AI decision-making, and 40% are somewhat involved. (NAVEX 2026 State of Risk & Compliance Report)
- 52% of organizations plan to introduce AI-based risk prediction tools. (Hyperproof – IT Risk and Compliance Report)
- AI pilots: 46% of companies are piloting AI in data analytics, and 36% are piloting AI for fraud detection. (PwC Global Compliance Survey 2025)
- Integration of AI in governance: Compliance team involvement in AI decision-making rose from 65% in 2025 to 78% in 2026.. (Navex State of Risk & Compliance 2025)
- Responsibility for AI policy: 39% assign AI policy responsibility to IT, while only 6% place it under compliance. (Navex State of Risk & Compliance 2025)
- Lack of visibility in AI risk: 67% list lack of visibility or missing controls as their biggest AI‑related risk. (Navex State of Risk & Compliance 2025)
- Data misuse concerns: 60% name data misuse or data loss as their top AI concern. (Navex State of Risk & Compliance 2025)
- Importance of AI: 65% believe AI is important to their compliance strategy, yet only 25% see it as critical. (Navex – 2026 State of Risk & Compliance Report)
- AI compliance policy adoption: 63% have an AI compliance policy, 33% are working on one, and 3% have no plans. (A‑Lign – 2026 Compliance Benchmark Report)
- Planned AI audits and certifications: 76% plan to pursue an AI audit or certification within 24 months, and 53% plan to adopt a compliance framework within 12 months. (A‑Lign Compliance Benchmark 2025)
- Concern about AI regulatory impact: 58% are concerned about AI’s impact on regulatory frameworks. (A‑Lign Compliance Benchmark 2025)
- 97% of respondents use AI to improve GRC workflows. (Hyperproof 2026 IT Risk and Compliance Benchmark Report)
- The share of organizations assessing AI tool security before deployment rose from 37% in 2025 to 64% in 2026. (World Economic Forum Global Cybersecurity Outlook 2026)
- 45% of leaders say their company has the internal resources and expertise needed for AI security assessments. (Cisco Cybersecurity Readiness Index 2025)
- 79% of organizations are using or actively planning to use agentic AI. (Vanta State of Trust Report)
- 65% say their use of agentic AI outpaces their understanding of it. (Vanta State of Trust Report)
- Only 48% have a framework in place to limit agentic AI autonomy. (Vanta State of Trust Report)
- 86% of business leaders with cybersecurity responsibilities reported at least 1 AI-related security incident in the past 12 months. (Cisco Cybersecurity Readiness Index 2025)
- 87% of respondents named AI-related vulnerabilities as the fastest-growing cyber risk over 2025. (World Economic Forum Global Cybersecurity Outlook 2026)
- 77% of organizations lack foundational data and AI security practices for critical models, data pipelines, and cloud infrastructure. (Accenture State of Cybersecurity Resilience 2025)
- Only 20% of organizations are confident in their ability to secure generative AI models against cyber risk. (Accenture State of Cybersecurity Resilience 2025)
- Organizations using AI in security saved $1.9 million in breach costs. (IBM Cost of a Data Breach Report 2025)
- 62% of frontline cybersecurity managers cite AI-driven attacks as their biggest challenge. (VikingCloud Cyber Crisis Perception Gap)
- Organizations using AI and automation extensively in security saved an average $1.9 million in breach costs compared with organizations that did not use these solutions. Source: IBM Cost of a Data Breach Report 2025.
- Organizations using AI for compliance report $1.9 million lower breach costs.
- Managers, at 62%, said AI-driven attacks are their single biggest challenge. Source: Enterprise Security Tech coverage of VikingCloud research.
Compliance Programs, Maturity and Structure Stats
- Department location: 49% of compliance functions sit within the CEO’s office, Legal or Risk departments. (NAVEX State of Risk & Compliance Report)
- Reporting to the CEO: 22% of compliance leaders report directly to the CEO; in large enterprises this falls to 10%. (NAVEX State of Risk & Compliance Report)
- Compliance incidents: 56% of organizations faced at least one compliance incident in the past three years, often a cybersecurity breach or third‑party ethics lapse. (NAVEX State of Risk & Compliance Report)
- Framework reliance: 44% rely on ISO standards as their main compliance framework (NAVEX State of Risk & Compliance Report)
- 93% of newly remote workers were confident their company could keep PII secure. (IBM Security Work From Home Study)
- GDPR fines hit nearly €100 million in H1 2022. (Atlas VPN analysis based on Enforcement Tracker data.)
- 90% of frontline cybersecurity managers say attacks are more frequent.(VikingCloud Cyber Crisis Perception Gap)
- 88% of frontline cybersecurity managers say attacks became more severe over the past 12 months. (VikingCloud Cyber Crisis Perception Gap)
- A new CVE is published every 17 minutes. (Skybox Security 2024 Vulnerability and Threat Trends Report.)
- 28.96% of known exploited vulnerabilities in 2025 were exploited on or before CVE publication. (VulnCheck State of Exploitation 2026)
- Regulatory vs. privacy concerns: 24% rank regulatory compliance as their top concern; 23% prioritize data privacy. (NAVEX State of Risk & Compliance Report)
- Aspirational leadership: 42% want their compliance program to lead the industry, yet only 33% believe they are currently at that level. (NAVEX State of Risk & Compliance Report)
- Ethical leadership promotion: 73% of executives promote ethical behavior, but 9% still tolerate or encourage misconduct. (NAVEX State of Risk & Compliance Report)
- Ethical leadership strength: High‑maturity programs show stronger ethical leadership (93%) than low‑maturity programs (71%). (NAVEX State of Risk & Compliance Report)
- Board oversight: 64% of boards receive regular compliance reports, while only 52% have formal oversight responsibility. (NAVEX State of Risk & Compliance Report)
- Board engagement: Just 33% of boards are deeply engaged in compliance governance. (NAVEX State of Risk & Compliance Report)
- Maturity gap: 57% of compliance programs operate at advanced maturity, yet 33% of leaders say they are leaders in the industry—illustrating ambition outpaces maturity. (NAVEX State of Risk & Compliance Report)
- Understaffed compliance: 62% of organizations feel they are understaffed in cybersecurity professionals. (TechTarget).
- Number of Chief Compliance Officers: There are over 50,000 chief compliance officers employed in the United States. (Zippia)
- Requests for proposal: 44% of companies require cybersecurity as part of their requests for proposal process. (TheSSLStore.com)
- Business disruptions from third‑party vendors: Over the past two years, around 45% of organizations have experienced business disruptions due to security risks linked to third‑party vendors (SentinelOne).
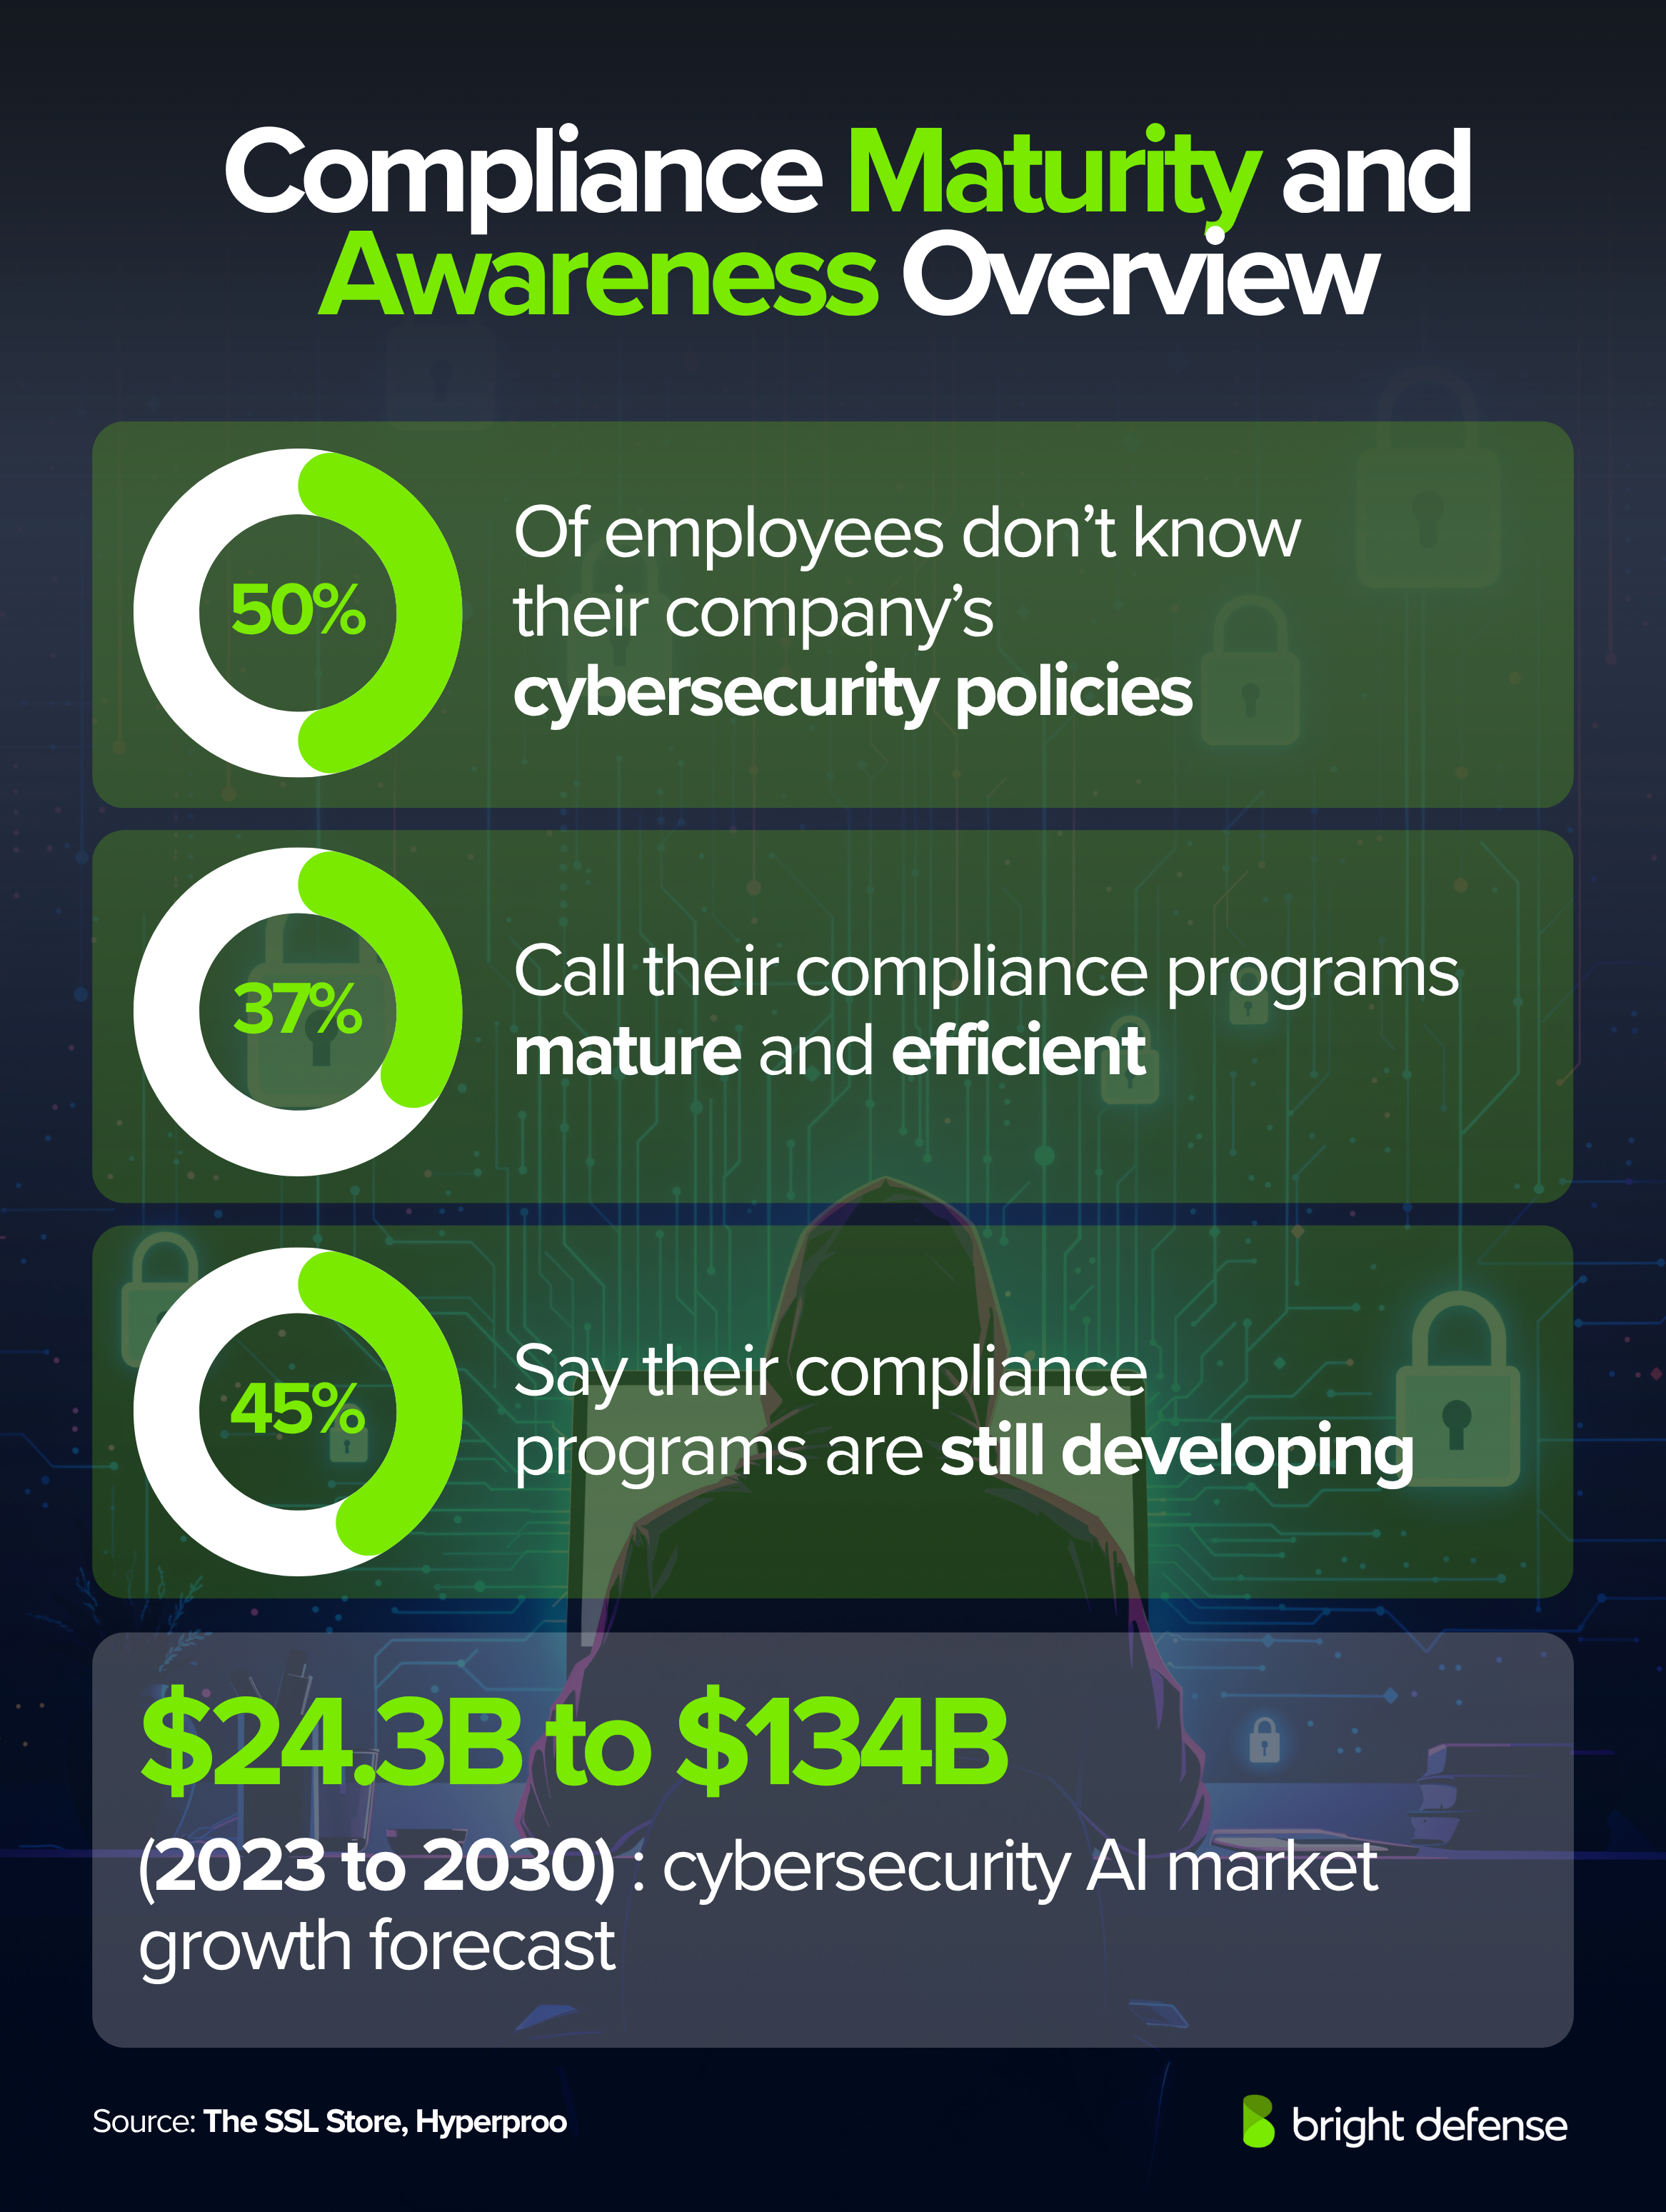
- Employee awareness: 50% of employees are unaware of their company’s cybersecurity policies and procedures (The SSL Store).
- Spreadsheets for compliance: 40% of companies use spreadsheets and word‑processing applications to manage compliance (NorthRow).
- Time spent on compliance: About 1 in 4 organizations spend fewer than 1,000 hours on compliance each year. Another 35% dedicate between 1,000 and 4,999 hours, 20% invest 5,000 to 9,999 hours, and the remaining 20% commit more than 10,000 hours annually. (Drata)
- 52% of public sector organizations report that limited resources and insufficient skills represent their main obstacle in building cyber resilience. (Drata)
- Investment growth: Legal and compliance department investment in governance, risk and compliance tools is expected to increase by 50% by 2026. (Gartner)
- Risk and compliance as business advisory: 80% of corporate risk and compliance professionals believe their organization views risk and compliance as essential business advisory roles; 74% agree these functions play a crucial role in facilitating business operations. (Thomson Reuters)
- Multiple frameworks requirement: Close to seven in ten service providers must comply with six or more distinct frameworks related to protecting data and maintaining security standards. (Coalfire Compliance Report)
- Cybersecurity AI market growth: The cybersecurity AI market is projected to grow from $24.3 billion in 2023 to $134 billion by 2030
- Investment in AI for cybersecurity: 94% of IT leaders are investing in AI for cybersecurity, with AI tools potentially saving companies over $2 million per breach. (All About AI)
- Use of AI in operations: 62% of enterprises are currently using AI in their cybersecurity operations. (All About AI)
- Bank executives and AI‑powered crime: 80% of bank cybersecurity executives say they cannot keep up with AI‑powered cybercriminals. (Business Insider)
- Internal compliance audits: 37% of businesses perform one or more internal compliance audits each year (Drata).
- Resource constraints: 27% of organizations lack resources for compliance audits (Keeve).
- Training agendas: Three out of five professionals in risk and compliance expect cybersecurity to dominate their training agendas for the next few years (Thomson Reuters).
- 83% feel confident their team can show the security program’s impact on the business, 89% measure impact in some form. (Vanta – State of Trust)
- Metrics used to gauge impact:
- Compliance and audit outcomes, 49%
- Operational efficiency, 47%
- Risk reduction, 47%
- Security maturity, 39%
- Return on security investment, 36%
- Customer revenue and retention, 33% (Vanta – State of Trust)
- 37% of organizations describe their compliance programs as mature and efficient.(Hyperproof – IT Risk and Compliance Report)
- 45% of organizations report their compliance programs are still developing. (Hyperproof – IT Risk and Compliance Report)
- 18% of organizations operate compliance processes that remain ad hoc or reactive. (Hyperproof – IT Risk and Compliance Report)
- Organizations with mature programs are 2.3 times more likely to meet regulatory audit deadlines. (Hyperproof – IT Risk and Compliance Report)
- Hyperproof 2026 reports that 86% of respondents have a centralized GRC team, while 14% rely on individual teams or business units. It reports that 57% have integrated risk and compliance functions, while 36% keep them separate. (Hyperproof – IT Risk and Compliance Report)
- 41% of organizations assign compliance oversight to their CISO. (Hyperproof – IT Risk and Compliance Report)
- 28% of organizations assign compliance oversight to their Chief Risk Officer. (Hyperproof – IT Risk and Compliance Report)
- 22% of organizations still assign compliance work to IT or security staff as a part-time duty. (Hyperproof – IT Risk and Compliance Report)
- 45% of organizations expect greater board oversight of compliance functions. (Hyperproof – IT Risk and Compliance Report)
- 33% of organizations aim to consolidate multiple compliance frameworks for greater efficiency. (Hyperproof – IT Risk and Compliance Report)
- 50% of respondents who manage risk ad hoc or only after a negative event experienced a breach in 2025. (Hyperproof 2026 IT Risk and Compliance Benchmark Report)
- Organizations using integrated automated risk management tools had a breach rate of 27%, compared with 50% for ad hoc risk management. (Hyperproof 2026 IT Risk and Compliance Benchmark Report)
- 56% of respondents use a common controls framework for GRC processes. (Hyperproof 2026 IT Risk and Compliance Benchmark Report)
- Only 4% of companies reached the Mature stage of overall cybersecurity readiness, while 70% remained in the Formative or Beginner categories. (Cisco Cybersecurity Readiness Index 2025)
- 90% of organizations lack the security maturity needed to counter modern AI-driven threats. (Accenture State of Cybersecurity Resilience 2025)
- Only 10% of organizations occupy Accenture’s Reinvention-Ready Zone for security maturity. (Accenture State of Cybersecurity Resilience 2025)
Compliance Motivations Stats
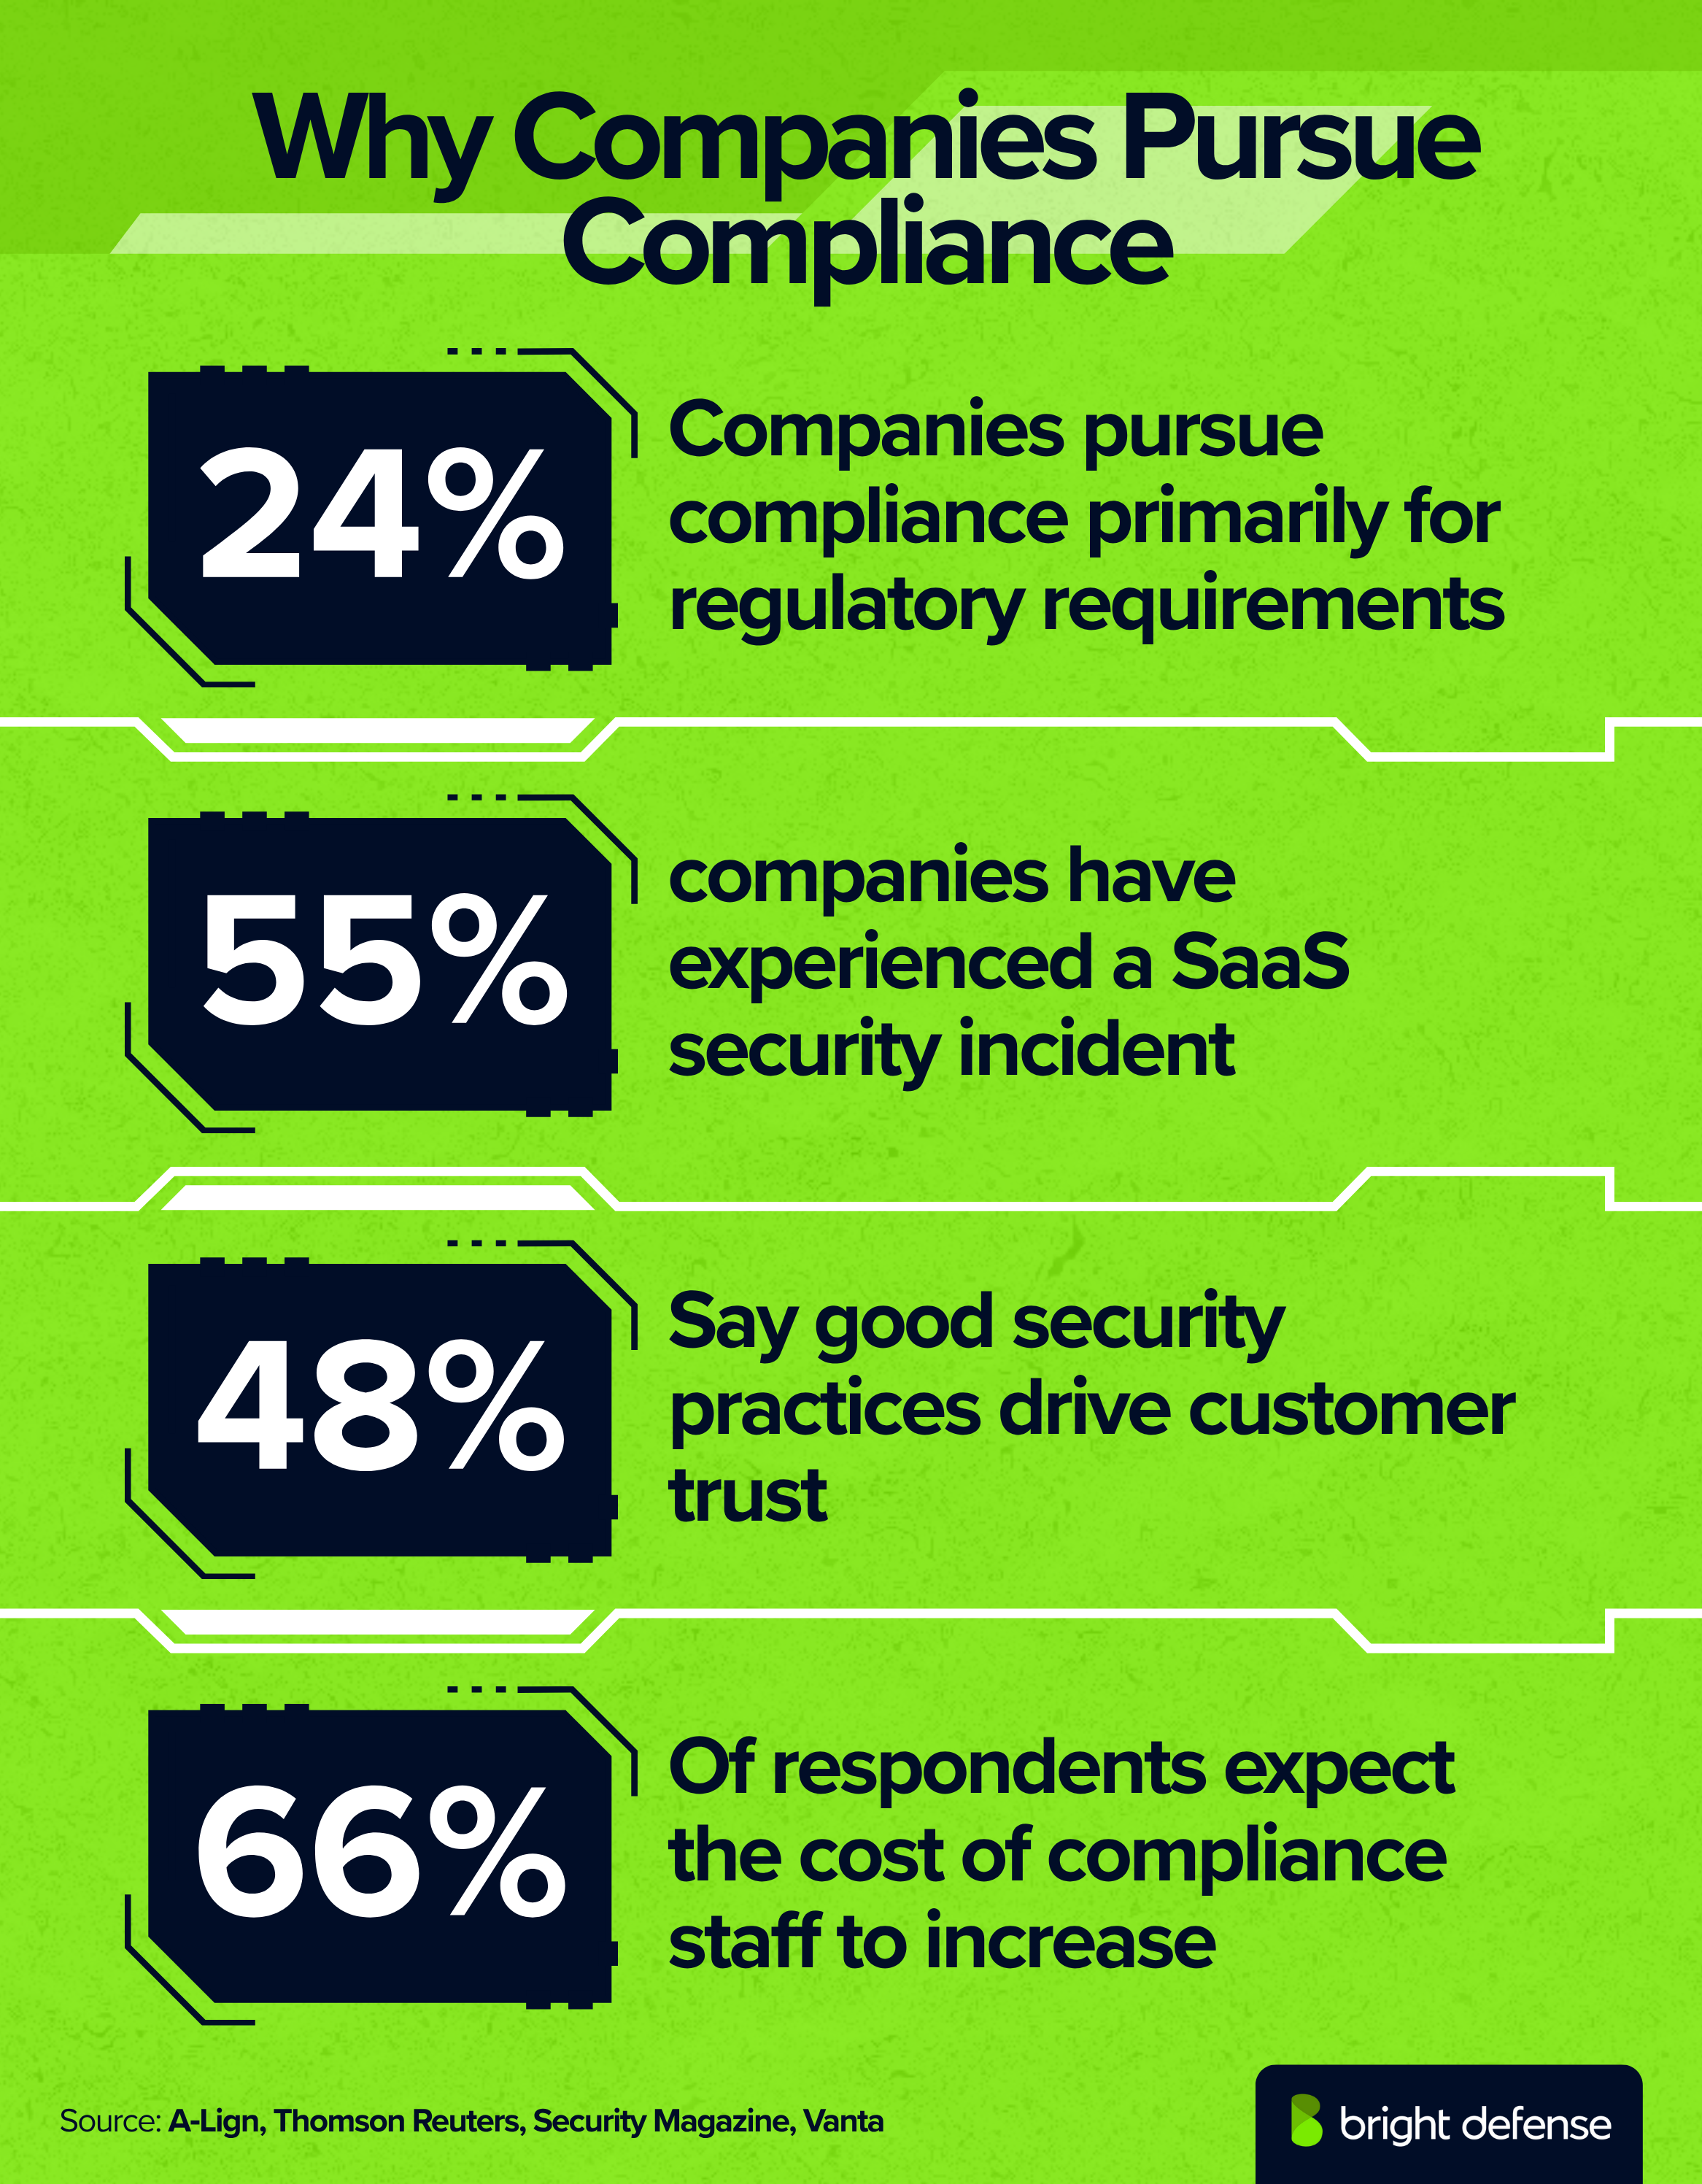
- Regulatory requirements: 24% pursue compliance primarily for regulatory requirements. (A‑Lign Compliance Benchmark 2024)
- Building customer trust: 19% focus on building trust with customers and partners. (A‑Lign Compliance Benchmark 2024)
- Validating IT controls: 17% aim to validate IT controls as a key objective. (A‑Lign Compliance Benchmark 2024)
- Revenue growth: 16% link compliance directly to revenue growth or winning new clients. (A‑Lign Compliance Benchmark 2024)
- Board or executive mandates: 14% cite board‑level or executive mandates as the driver. (A‑Lign Compliance Benchmark 2024)
- Prioritizing trust: The number of companies prioritizing trust grew 36% year‑over‑year, while those focusing on IT control validation grew 5%. (A‑Lign Compliance Benchmark 2024)
- Continuous compliance slow sales: 41% of companies report that lack of continuous compliance slows down sales cycles. (Drata)
- SaaS security incidents: 55% of companies have experienced a SaaS security incident. (Security Magazine)
- Monitoring SaaS stack: Only 7% of companies monitor their entire SaaS stack, with 68% monitoring less than half. (The Hacker News)
- Staff cost expectations: 66% of respondents expect the cost of compliance staff to increase. (Thomson Reuters)
- 82% believe stronger security and compliance improves customer trust, up from 67% in 2024. 77% say stakeholders demand verified proof of compliance, up from 65% in 2024. (Vanta – State of Trust)
- 48% say good security practices drive customer trust, up from 41% in 2023. (Vanta – State of Trust)
- Reported benefits of good security practices:
- Reduced financial risk, 46%
- Improved reputation, 42%
- Meeting customer security demands, 41%
- Operational efficiencies, 41% (Vanta – State of Trust)
- 56% of organizations report a recent vendor breach. (Vanta State of Trust Report)
- 77% of respondents said cyber-enabled fraud and phishing increased over the past year. (World Economic Forum Global Cybersecurity Outlook 2026)
Ethics, Reporting and Whistleblowing Stats
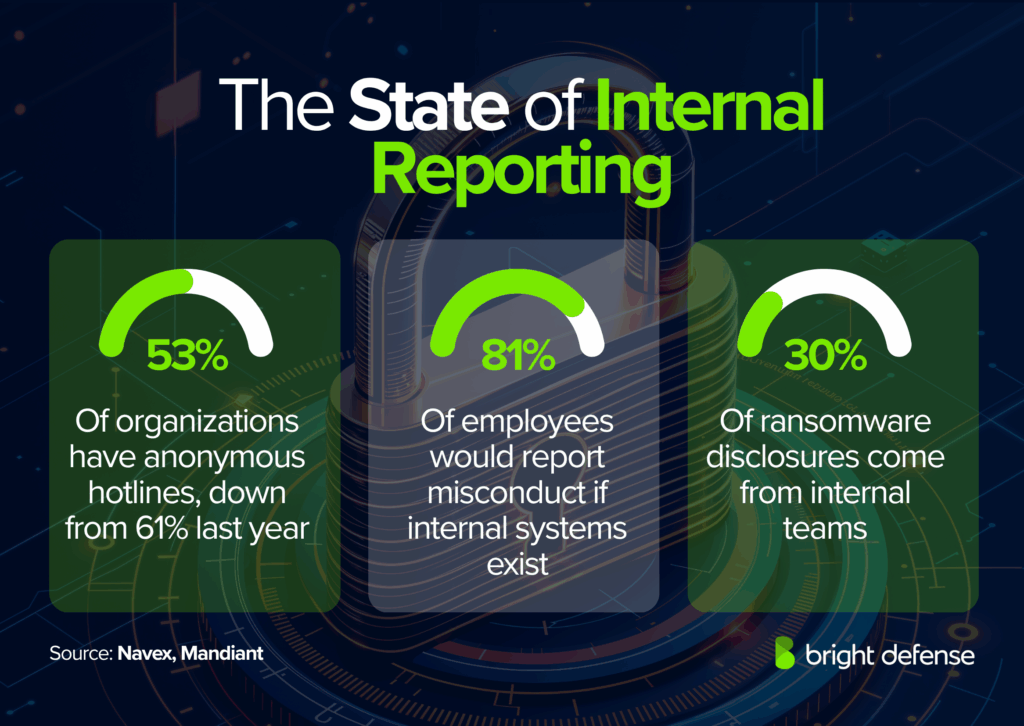
- Anonymous reporting hotlines: Only 53% of organizations maintain anonymous reporting hotlines, down from 61% the prior year. (Navex State of Risk & Compliance 2025)
- Non‑retaliation policies: 49% have clear non‑retaliation policies, leaving half without this safeguard. (Navex State of Risk & Compliance 2025)
- Employee willingness to report: 81% of employees say they would report misconduct internally when internal systems exist. (Navex State of Risk & Compliance 2025)
- Visibility into case closure: 51% of compliance teams have full visibility into how cases are investigated and closed. (Navex State of Risk & Compliance 2025)
- Leadership feedback: 55% include leadership feedback as a factor when measuring compliance program performance. (Navex State of Risk & Compliance 2025)
- Whistleblower channels prevalence: 47% do not include anonymous reporting options, 51% say leaders encourage speaking up, 51% say employees fear negative career consequences, and 18% cite retaliation as a reporting deterrent. (Navex – 2026 State of Risk & Compliance Report)
- Ransomware disclosure: 49% of ransomware cases are reported by attackers themselves, while 21% are reported by external parties and 30% by internal teams. (M‑Trends)
- Time to detect ransomware: The typical time to detect ransomware is six days overall, but detection stretches to 29 days when detected internally. (M‑Trends)
- Detection of intrusions: 45.1% of intrusions are detected within one week of initial compromise, reflecting improved detection speed. (M‑Trends)
- Initial access vectors: Most breaches start via software exploits (33%), stolen credentials (16%) or phishing emails (14%). (M‑Trends)
- Preference for brute force and stolen credentials: For ransomware incidents, 26% of initial access comes from brute‑force attacks and 21% from stolen credentials. (M‑Trends)
- Financial motive in intrusions: Data theft appears in 37% of investigations; 35% of intrusions have a financial motive and 21% involve ransomware. (M‑Trends)
- 54% of boards receive regular compliance updates, but only 42% provide strategic oversight of the compliance program. (NAVEX 2026 State of Risk & Compliance Report)
Compliance Training and Policy Management Stats
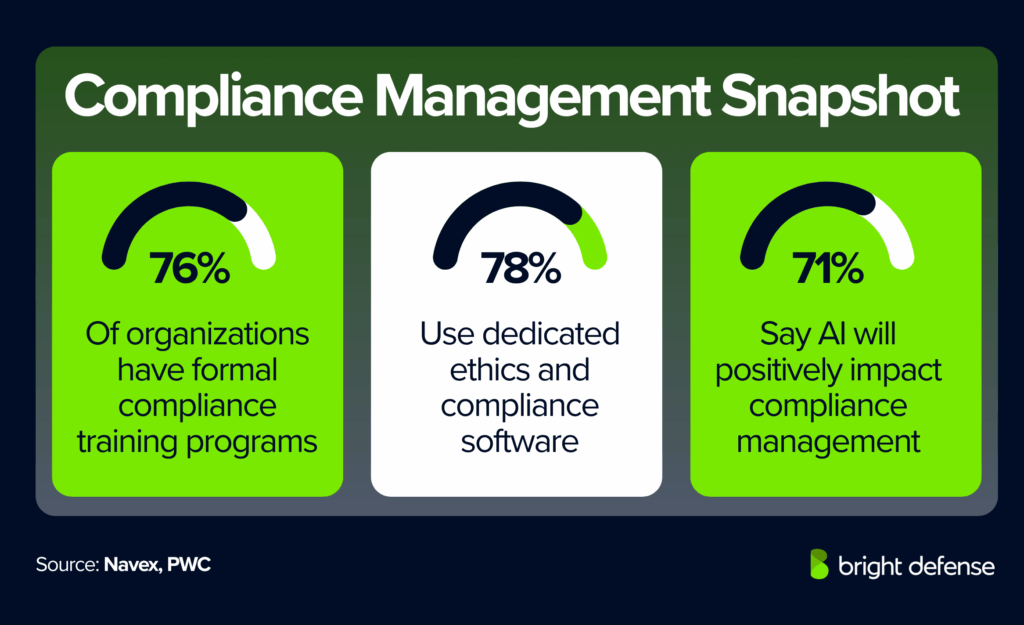
- Formal training plans: 76% of organizations have formal compliance training plans, up from 69% a year earlier. (Navex State of Risk & Compliance 2025)
- Planned training topics: For the next two years, 62% plan training on data privacy, 60% on cybersecurity and 48% on AI. (Navex State of Risk & Compliance 2025)
- Diversity and inclusion training: Only 37% expect to train on diversity and inclusion. (Navex State of Risk & Compliance 2025)
- Measuring policy effectiveness: 50% measure policy effectiveness through employee training results. (Navex State of Risk & Compliance 2025)
- Including compliance in risk assessments: 93% include compliance in risk assessments, but only 61% apply the results to strengthen programs. (Navex State of Risk & Compliance 2025)
- Keeping risk assessments current: 70% keep their risk assessments current and periodically reviewed, yet only 24% find them truly effective (Navex).
- Reluctance to assess risk: 9% admit fear of exposing internal weaknesses limits their willingness to assess risks openly. (Navex State of Risk & Compliance 2025)
- Technology adoption for training: The top three compliance areas where technology is used are training (82%), risk assessment (76%) and compliance/transaction monitoring (75%). (PwC Global Compliance Survey 2025)
- Complex data hindering compliance: 63% of respondents cite the complexity and disaggregated nature of data across the organization as a factor making compliance more difficult. (PwC Global Compliance Survey 2025)
- Risk priorities: Cybersecurity and data protection/privacy are cited as key compliance risk priorities for 51% of respondents. (PwC Global Compliance Survey 2025)
- Transforming compliance function: 84% of organizations aim to transform their compliance function to be a leading or mature capability within the next three years. (PwC Global Compliance Survey 2025)
- Training data practices:
- 31% use a mix of customer and synthetic data.
- 27% use anonymized customer data.
- 25% require customer opt-in.
- Over 75% do not offer an opt-out. (Vanta – State of Trust)
- 73% of organizations conduct compliance training once each year. (Hyperproof – IT Risk and Compliance Report)
- 36% of organizations deliver quarterly refreshers or microlearning sessions. (Hyperproof – IT Risk and Compliance Report)
- 62% of organizations say executive involvement improves compliance adoption rates. (Hyperproof – IT Risk and Compliance Report)
- 18% of organizations continue to use static slide-based training materials with low engagement. (Hyperproof – IT Risk and Compliance Report)
- 48% of leaders believe employees understand how malicious actors use AI to improve attacks. (Cisco Cybersecurity Readiness Index 2025)
Technology Adoption and Program Efficiency in Compliance
- Use of dedicated platforms: 78% use dedicated software for ethics and compliance training and 70% use dedicated software for risk management. (Navex State of Risk & Compliance 2025)
- Compliance platform usage among small firms: 58% of small firms use compliance platforms to manage incidents. (Navex State of Risk & Compliance 2025)
- Integrating risk management programs: 30% have fully centralized, integrated risk management programs, and another 44% are partially integrated. (Navex State of Risk & Compliance 2025)
- Technology investment plans: 82% of companies plan to increase investment in at least one technology to automate and improve compliance activities. (PwC Global Compliance Survey 2025)
- Number of tech‑enabled activities: 49% of respondents are using technology for 11 or more distinct compliance activities. (PwC Global Compliance Survey 2025)
- Top technology applications: Training (82%), risk assessment (76%) and transaction monitoring (75%) are the top areas where technology is used. (PwC Global Compliance Survey 2025)
- Visibility and productivity benefits: Technology investment yields better visibility of risks (64%), faster issue identification (53%) and increased productivity and cost savings (43%). (PwC Global Compliance Survey 2025)
- Fear of exposing weaknesses: 9% say fear of exposing internal weaknesses limits willingness to assess risks. (Navex State of Risk & Compliance 2025)
SOC 2 Compliance Statistics
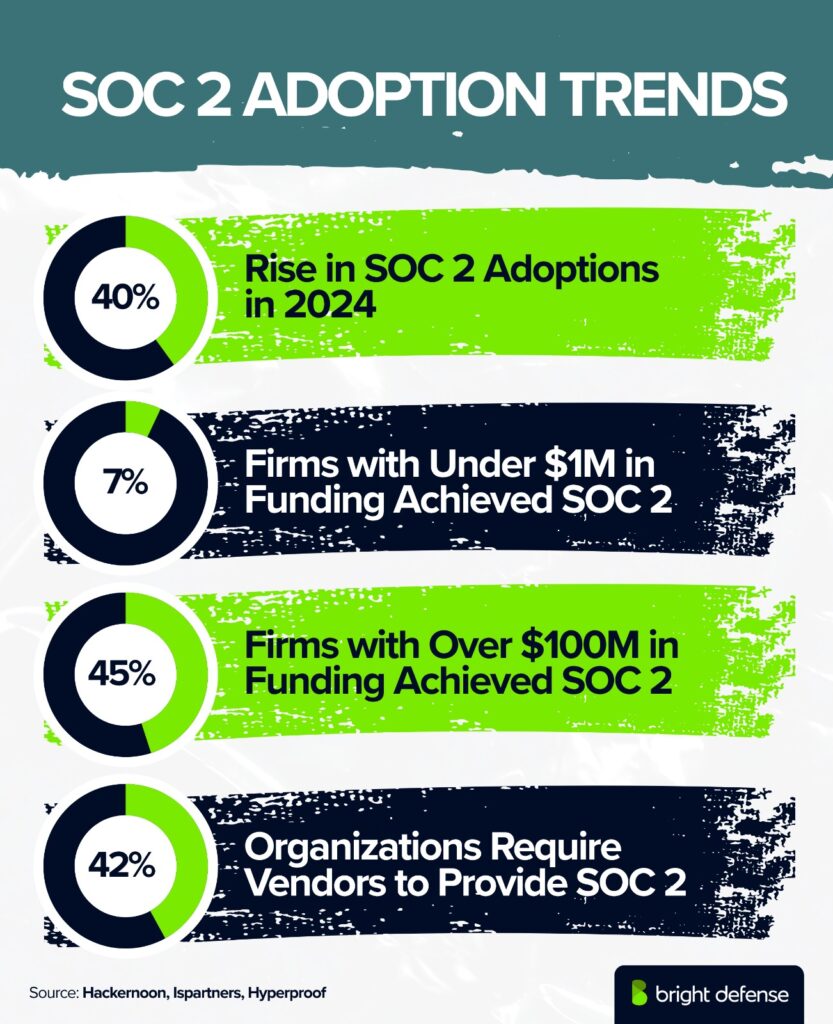
- SOC 2 adoption by funding level: 7% of companies with less than $1 million in funding have achieved SOC 2, while 45% of companies with over $100 million in funding have achieved SOC 2 (Hackernoon).
- Increase in SOC 2 adoption: SOC 2 adoptions rose 40% in 2024. (Ispartners)
- Cost of SOC 2 preparation: The total cost of SOC 2 Type 1 preparation and certification is approximately $91,000 for companies with fewer than 50 employees and $186,000 for companies with 50 to 250 employees. (UnderDefense)
- Average SOC 2 Type 1 audit cost: The average total cost of a SOC 2 Type 1 audit in time and expense is $147,000. (StrongDM)
- Start‑up preference: 60% of companies are more likely to work with a startup that has achieved SOC 2. (Ispartners)
- Venture capital preference: 70% of venture capitalists prefer investing in companies with SOC 2 compliance. (Ispartners)
- Type 2 audit cost range: SOC 2 Type 2 audit costs typically range from$20,000 to $100,000 depending on criteria, complexity and in‑scope components (Linford & Company LLP).
- Type 2 audit fees: SOC 2 Type 2 audit fees typically range from $15,000 to over $60,000 depending on organizational size, complexity and audit scope. (Cyber Vantage 360).
- Type 1 audit fee range: SOC 2 Type 1 audit fees are typically between $5,000 and $25,000 depending on how many of the trust services criteria are included (Sprinto.com).
- Type 2 audit expenses: Type 2 audits tend to cost more, with expenses ranging from $7,000 to $50,000 based on organizational size, system complexity and scope (Sprinto.com).
- Preparation outlays: Beyond audit fees, companies should anticipate additional outlays of $15,000 to $85,000 for preparatory work, tools and internal team time (Secureframe)
- 58% of organizations have adopted SOC 2 certification, making it the most common. (Hyperproof – IT Risk and Compliance Report)
- 42% of organizations require vendors to provide SOC 2 or ISO certification. (Hyperproof – IT Risk and Compliance Report)
- Cumulative cost: The cumulative cost of SOC 2 certification, including external audits and internal readiness, often falls in the mid‑five‑ to six‑figure range depending on organizational maturity. (UnderDefense) For a full breakdown of how these figures vary by audit type and company size, see our guide to SOC 2 certification cost.
CMMC and Defense Sector Compliance Statistics
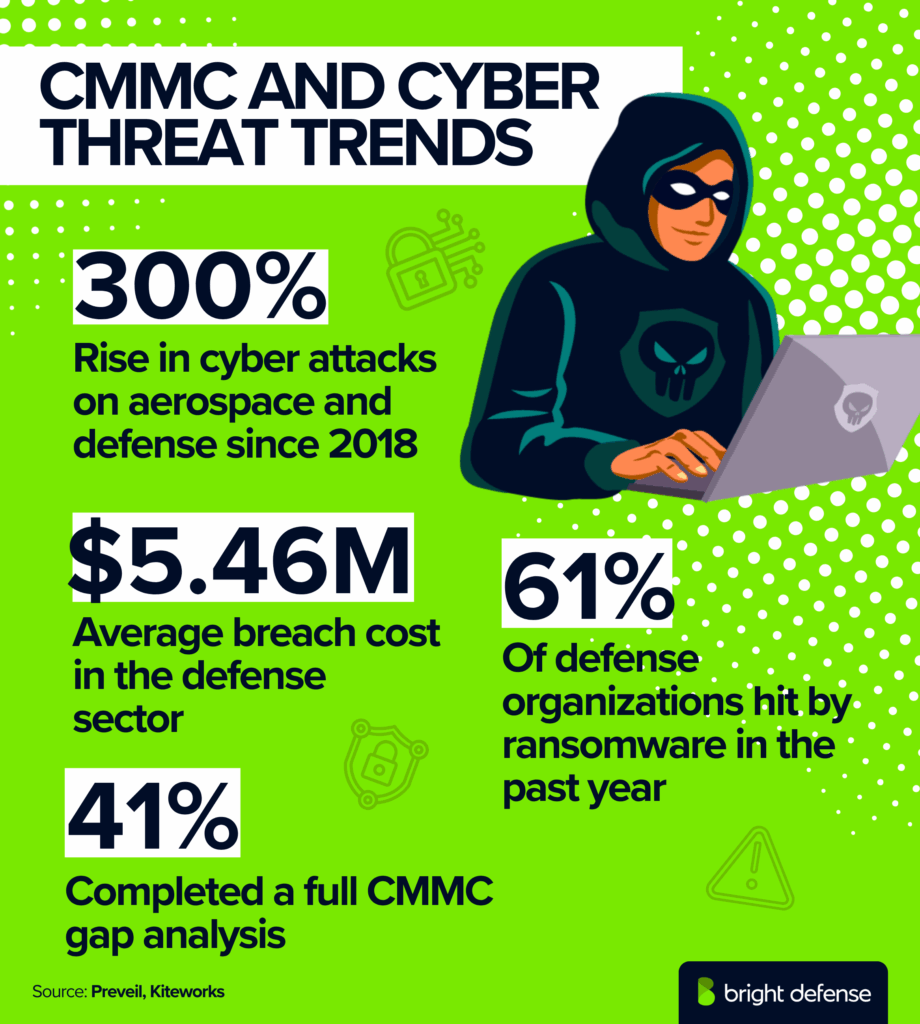
- Growth in aerospace cyberattacks: The aerospace and defense sector has seen a 300% increase in cyber attacks since 2018 (Prevail).
- Average breach cost in defense: The defense sector sees an average data breach cost of $5.46 million (Prevail).
- Breach prevalence: More than 80% of aerospace and defense organizations reported experiencing at least one data breach in the past year (Prevail).
- Ransomware in defense: 61% of defense organizations faced a ransomware attack within the last 12 months (Prevail).
- Budget constraints: 31% of defense organizations say limited budgets and resources make it difficult to build an effective cybersecurity program (Prevail).
- Scope of CMMC: The Cybersecurity Maturity Model Certification affects an estimated 300,000 companies (Washington Technology).
- Third‑party assessments: Approximately 80,000 companies will require third‑party CMMC assessments to win Department of Defense contracts (Federal News Network).
- Level 1 compliance costs: CMMC Level 1 compliance costs between $3,000 and $5,000; Level 5 can reach $482,874. Smaller defense suppliers weighing these costs can review our guidance on CMMC for small businesses.
- 41% of organizations have completed a full CMMC gap analysis. (Kiteworks – CMMC Preparedness)
- 37% are currently conducting one, while 16% plan to begin soon. (Kiteworks – CMMC Preparedness)
- 73% of those with completed gap analyses have fully documented cybersecurity policies. (Kiteworks – CMMC Preparedness)
- 77% of those same organizations follow verified encryption standards. (Kiteworks – CMMC Preparedness)
- 61% of organizations have fully documented security policies. (Kiteworks – CMMC Preparedness)
- 83% of these fully documented organizations follow encryption standards, compared with 49% among those partially documented. (Kiteworks – CMMC Preparedness)
- 75% of well-documented organizations maintain advanced third-party access controls. (Kiteworks – CMMC Preparedness)
- 69% of organizations follow documented encryption standards. (Kiteworks – CMMC Preparedness)
- 84% of those with documented encryption conduct continuous monitoring. (Kiteworks – CMMC Preparedness)
- 66% of organizations have advanced controls for controlled unclassified information (CUI) access. (Kiteworks – CMMC Preparedness)
- 78% of those with advanced controls have documented policies, and 77% maintain vendor management programs. (Kiteworks – CMMC Preparedness)
- 36% cite budget or resource constraints as their main challenge. (Kiteworks – CMMC Preparedness)
- 31% cite technical complexity. (Kiteworks – CMMC Preparedness)
- 34% have approved budgets with dedicated compliance teams, while 48% have partial funding. (Kiteworks – CMMC Preparedness)
- Organizations that completed a gap analysis are 3x more likely to have strong controls. (Kiteworks – CMMC Preparedness)
- 69% with documented encryption show higher readiness across all metrics. (Kiteworks – CMMC Preparedness)
- 76% of those working with experienced compliance partners achieve advanced access controls. (Kiteworks – CMMC Preparedness)
- 91% of the largest organizations changed cybersecurity strategy because of geopolitical volatility. (World Economic Forum Global Cybersecurity Outlook 2026)
- 64% of organizations include geopolitically motivated cyberattacks in their cyber risk mitigation strategy. (World Economic Forum Global Cybersecurity Outlook 2026)
HIPAA and Healthcare Compliance Statistics
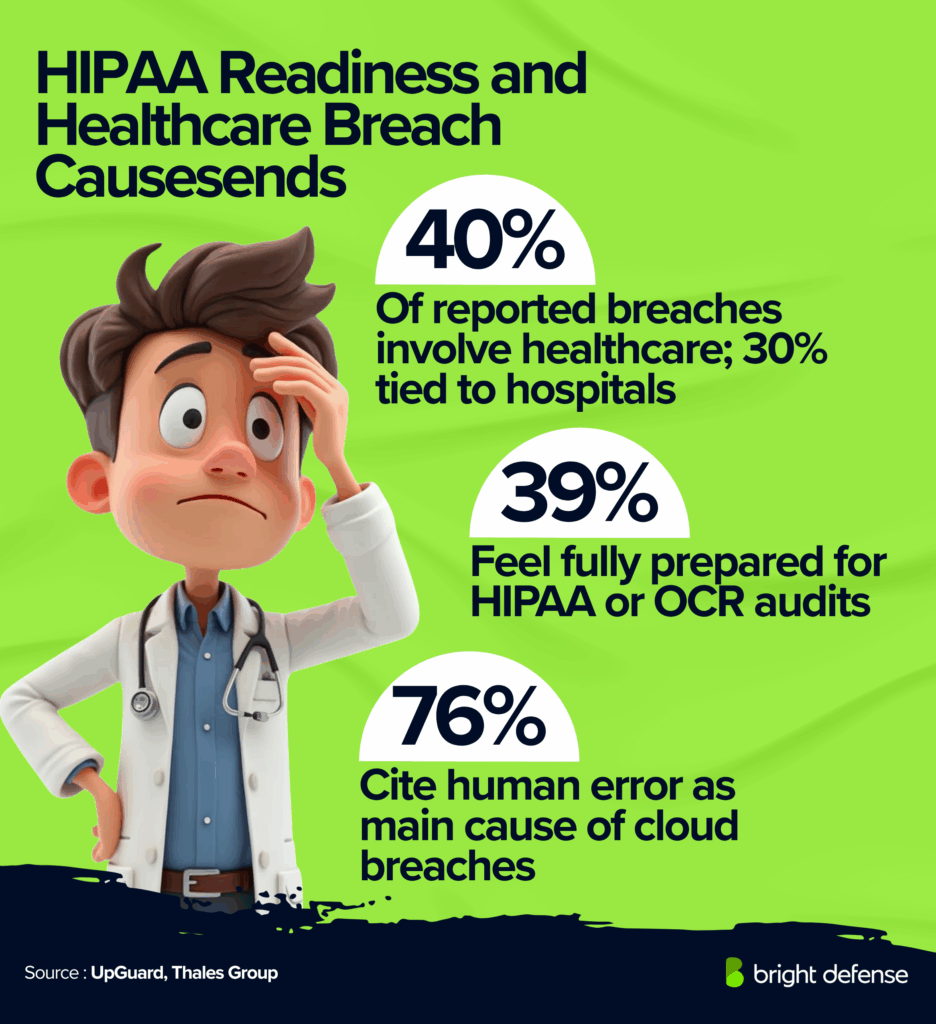
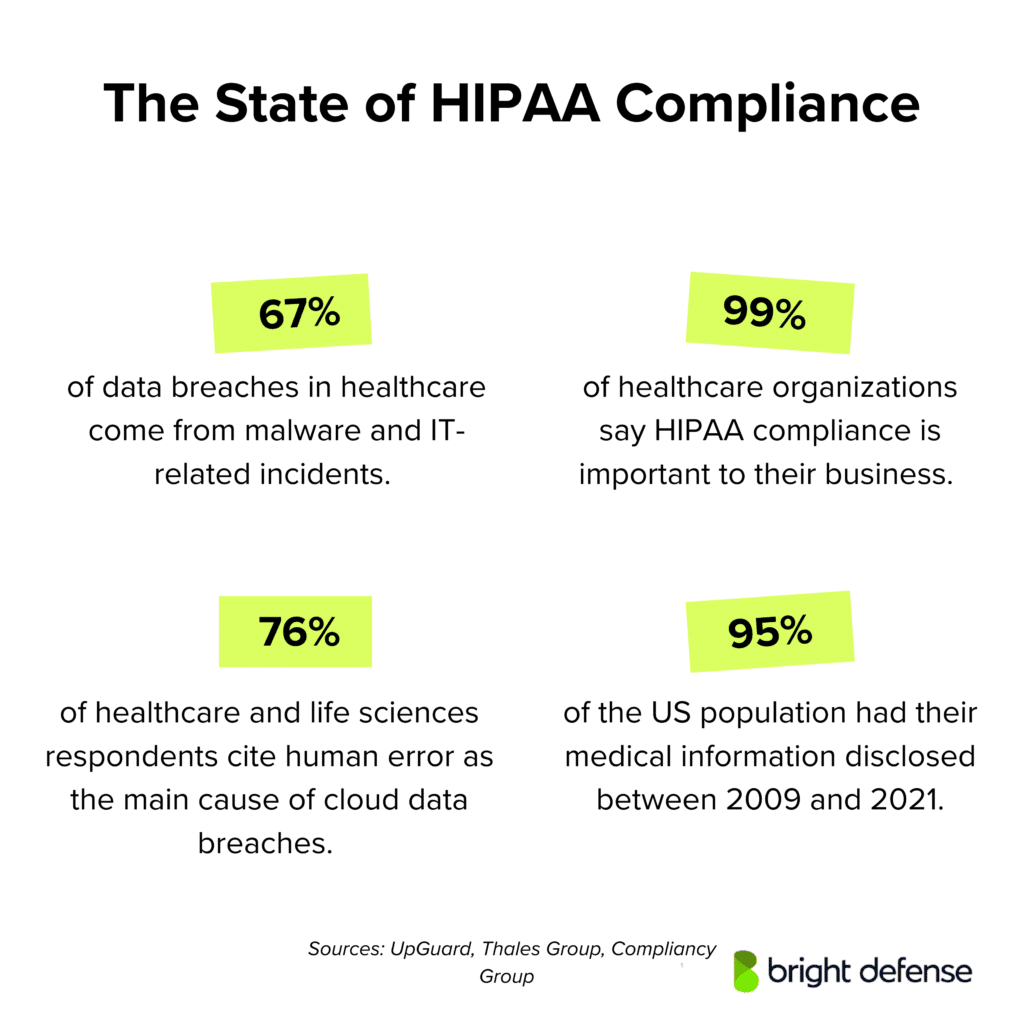
- Healthcare share of breaches: Healthcare makes up 79% of all reported breaches, and hospitals are involved in 30% of the major ones. (UpGuard )
- Exposure of medical information: 67% of healthcare data breaches expose medical information; 34% result from unauthorized access or disclosure of protected health information. (UpGuard )
- Preparation for HIPAA audits: Only 39% of respondents feel fully prepared for HIPAA or OCR audits. (Compliance.com) Organizations closing that gap can follow our steps on how to become HIPAA compliant.
- Independent privacy review: Only 29% have conducted an independent review of their HIPAA privacy program. (Compliance.com).
- Delay implementing reproductive health rules: 60% plan to delay implementing changes for the OCR’s Reproductive Health Care Privacy Final Rule until the compliance deadline approaches. (Compliance.com)
- Breach causes: 67% of healthcare data breaches come from malware and IT‑related incidents, accounting for 92% of all exposed medical records. ( UpGuard )
- HIPAA training for associates: 55% of organizations do not mandate HIPAA training for their business associates. (Compliance.com)
- Top compliance risk: Half of organizations cite improper or accidental disclosure of PHI by employees as a top compliance risk. (Compliance.com)
- Human error in cloud breaches: 76% of healthcare and life sciences respondents cite human error as the main cause of cloud data breaches. (Thales Group)
- Record exposure volume: From 2009 to 2023, over 519 million healthcare records were exposed or improperly disclosed. (The HIPAA Journal)
- Projected cybersecurity spending: Healthcare cybersecurity spending is projected to total $125 billion between 2020 and 2025. (Cyber Security Magazine)
- Importance of HIPAA: 99% of healthcare organizations say HIPAA compliance is important to their business. (Compliancy Group)
- Medical information disclosure: Approximately 95% of the U.S. population had their medical information disclosed between 2009 and 2021. (UpGuard)
- OCR fines: In 2024, OCR fines ranged from $10,000 to $4.75 million; the largest penalty was in 2018 when Anthem paid $16 million for a breach affecting 78.8 million people. (The HIPAA Journal)
- Increase in HIPAA complaints: Complaints about HIPAA violations increased 39% from 2017 to 2021. (Fierce Healthcare)
- Corrective action or penalties: Organizations were forced to take corrective action or pay penalties in 83% of HIPAA violation cases in 2021. (Fierce Healthcare)
- Scale of email exposure: Approximately 1 billion emails were exposed in a single year, impacting one out of every five internet users globally. (AAG)
- Confidence in passing audits: 60% of respondents in healthcare were not confident they would pass a HIPAA audit. (Compliancy Group)
- Cybersecurity readiness: 75% of surveyed healthcare services say their cybersecurity infrastructure is unprepared for cyber threats. (UpGuard)
- Documentation of compliance: Only 34% had fully documented their HIPAA compliance. (Compliancy Group).
- Hacking causes: In 2023, hacking accounted for 79.7% of data breaches, up from 49% in 2019. (The HIPAA Journal)
- 39% say good security practices bring peace of mind. (Hyperproof – IT Risk and Compliance Report)
- Hyperproof 2026 reports that 58% expect to spend more on GRC in 2026, 70% have GRC budgets over $1M, 92% had the budget and resources needed in 2025, and 68% expect team sizes to grow over the next 2 years. (Hyperproof – 2026 IT Risk and Compliance Benchmark Report)
Latest Compliance Trends
Now we’ll look at some of the latest trends in the compliance industry. Much of the data in this section comes from the study “Gartner’s Top 5 Priorities for Compliance in 2025.”The report highlights key strategic priorities for compliance leaders in 2025, based on a survey of 33 professionals in the field.
Studies and reprots from other sources were also included.
Let’s take a closer look:
Trend Overview
- 76% of compliance leaders rank third-party risk as the top priority, and 82% experienced related issues in the past year.
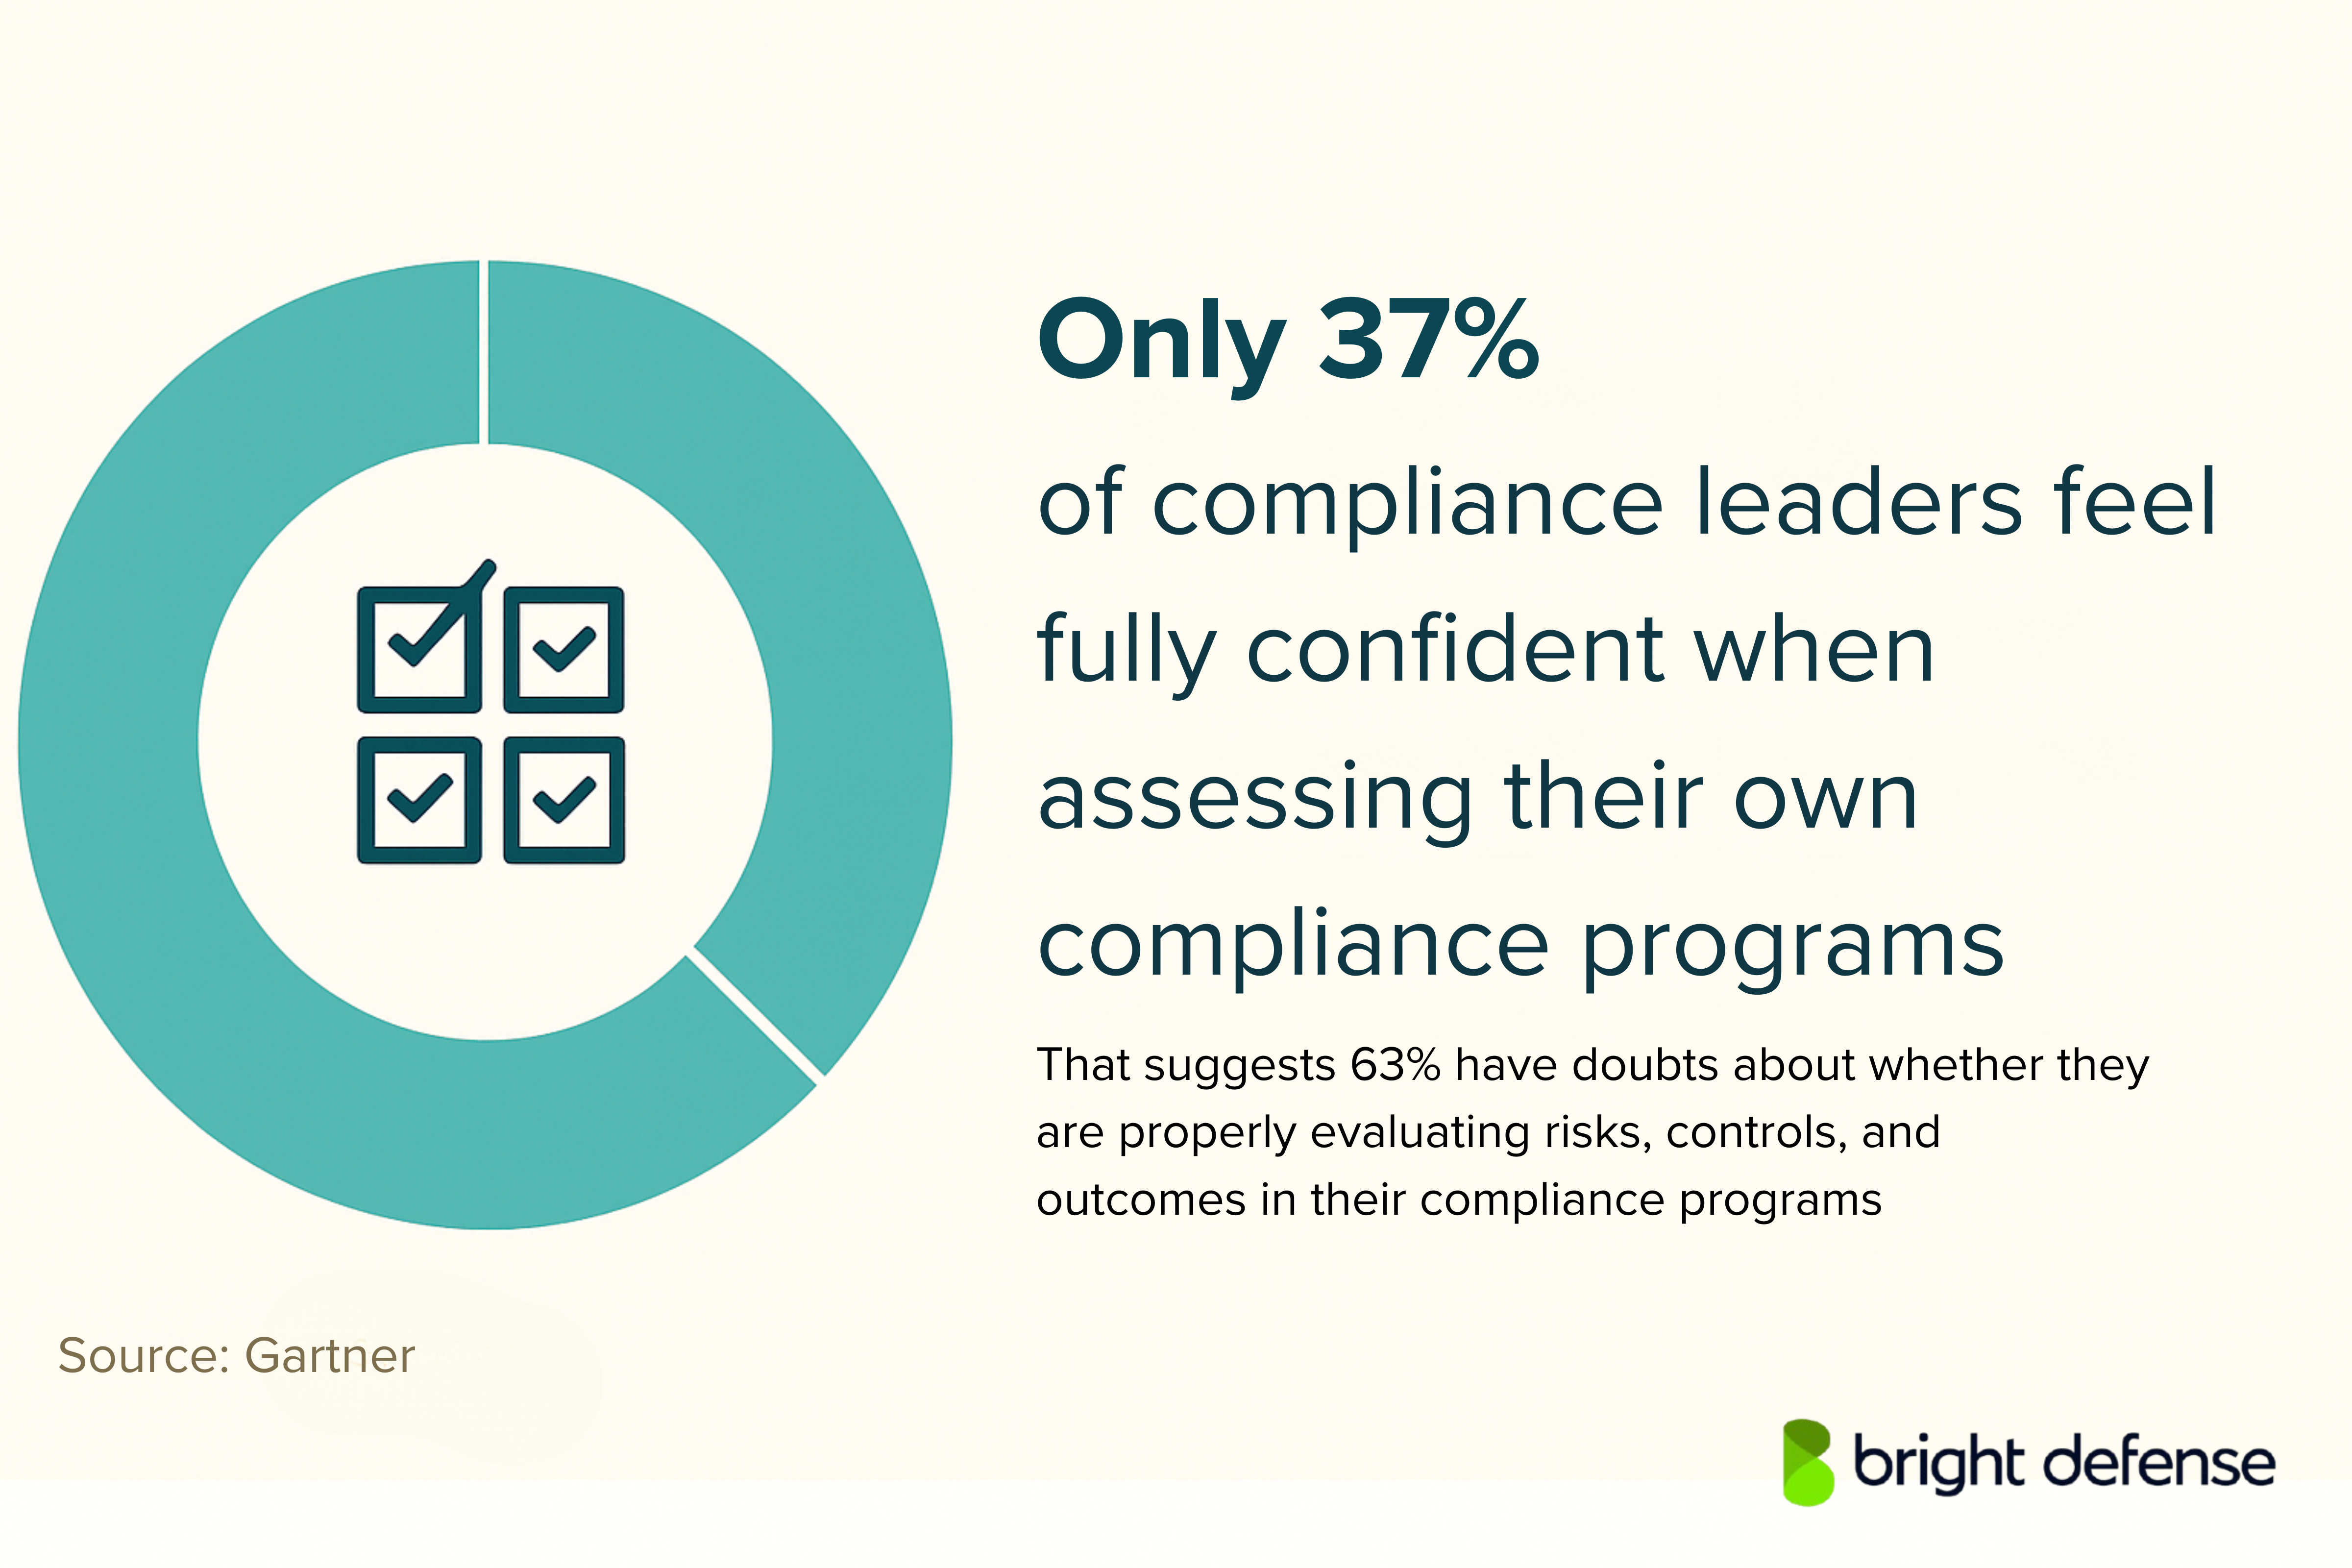
- 64% are prioritizing better measurement of program effectiveness, but only 37% feel confident in current methods.
- ESG compliance is rising in importance, driven by new rules like the CSRD and Germany’s Supply Chain Act.
- SaaS security is a high or highest priority for 86% of organizations. (CSA State of SaaS Security 2025)
- 76% of organizations increased SaaS security budgets over the past 2 years. (CSA State of SaaS Security 2025)
- 63% of organizations report external oversharing of sensitive data in SaaS apps. (CSA State of SaaS Security 2025)
- 56% say sensitive data is uploaded to unauthorized apps. (CSA State of SaaS Security 2025)
- 55% say employees adopt SaaS applications without security involvement. (CSA State of SaaS Security 2025)
- 57% report fragmented SaaS administration. (CSA State of SaaS Security 2025)
- 46% of organizations struggle to monitor non-human identities such as OAuth tokens, APIs, and service accounts. (CSA State of SaaS Security 2025)
- 56% say third-party vendors and GenAI tools have overprivileged API access to sensitive data. (CSA State of SaaS Security 2025)
- 88% of cybersecurity professionals reported at least 1 major consequence from team skill deficiencies, and 69% reported more than 1. (ISC2 Cybersecurity Workforce Study)
- AI is the top security team skill need, cited by 41% of respondents. (ISC2 Cybersecurity Workforce Study)
- 70% of cybersecurity professionals have or are pursuing AI qualifications to stay relevant. (ISC2 Cybersecurity Workforce Study)
- 72% of cybersecurity professionals believe AI will create demand for more strategic cybersecurity roles and skills. (ISC2 Cybersecurity Workforce Study)
1. Third-Party Risk Management Takes Top Priority
Managing third-party risk is the most urgent issue for compliance teams in 2025. 76% of surveyed compliance leaders ranked it as a top priority, and more than 82% said they experienced direct consequences from third-party risk in the past 12 months. These findings align with what many survey respondents from the latest global compliance survey have also reported.
The focus has expanded from basic due diligence to full lifecycle risk oversight. 84% of leaders are emphasizing stronger upfront third party due diligence processes, while 81% are enhancing ongoing monitoring after a relationship begins.
These findings suggest that surface-level checks are no longer enough. Data from a broader Gartner benchmarking survey of 939 leaders shows that clear compliance responsibilities significantly improve third-party risk outcomes.
Organizations that fail to define ownership across the risk process will remain vulnerable to hidden gaps and coordination failures. (Gartner’s Top 5 Priorities for Compliance in 2025)
Data breaches continue to surface across industries, exposing sensitive information from major companies and users alike. Here’s a roundup of the most recent data breach incidents and the impact they’ve had.
2. Improving the Quality of Risk Detection Data
The industry is also moving away from static metrics in favor of better data and analytics. 67% of compliance leaders said improving the quality of data used for risk detection is a key goal this year, reflecting growing compliance pressures on data-driven oversight.
Historically, organizations have relied on indicators like helpline call volume or training completion rates. These are now viewed as incomplete or reactive.
More advanced teams are using KRIs and KPIs in tandem to assess program effectiveness and detect patterns. Some have integrated structured data into GRC or BI platforms and are beginning to use AI/ML for automated risk insights.
However, manual processes and poor data governance still limit progress. Compliance programs that can’t analyze real-time data will be slower to catch threats, especially as regulators increase expectations for monitoring sophistication. (Gartner’s Top 5 Priorities for Compliance in 2025)
3. Rapid Growth of AI Governance Obligations
AI is moving fast across business functions and compliance teams are under pressure to keep up. 67% of compliance leaders in the Gartner study said AI governance is a top priority for 2025. New laws from NYC’s AEDT rule to China’s generative AI policies, the EU AI Act, and the U.S. Executive Order are forcing action across different industry sectors.
Companies are already using AI to handle compliance tasks like fraud detection, risk modeling, and data security reporting. Despite concerns about errors and unclear rules, many are moving forward with automation and exploring compliance AI tools for control validation.
Compliance is no longer just interpreting policy. It now has to enforce it through oversight, setting decision rights, and applying ethical standards. Gartner points to five areas compliance should focus on:
- Transparency
- Fairness
- Human Oversight
- Risk Management
- Privacy
Compliance will not be able to sit this out. It has to work with business and technical teams to enforce clear guardrails around AI. (Gartner’s Top 5 Priorities for Compliance in 2025 & WSJ)
4. Stronger Measurement of Program Effectiveness
Measuring how well compliance programs actually work has become a strategic necessity. 64% of compliance leaders say this is a focus for 2025, yet only 37% currently feel confident in their ability to assess program effectiveness across different program elements.
Recent DOJ guidance calls for organizations to use data to evaluate how well compliance efforts function, not just to react after issues occur. Tools like the Compliance and Culture Effectiveness Quotient (CCEQ) allow organizations to gather insight on employee perception, behavior, and ethical expectations. These insights help senior management better understand whether current compliance practices are effective or need refinement.
Leaders are also tracking whether employees understand policies, feel empowered to report misconduct, and know how to act when facing ethical dilemmas. This approach strengthens internal audit department collaboration and supports training employees on real-world compliance scenarios. It signals a move toward real-time, experience-driven assessments rather than traditional policy checks or isolated audits. (Gartner’s Top 5 Priorities for Compliance in 2025)
5. Strengthening Privacy Controls in a Shifting Risk Environment
Data privacy continues to be a focal point, with regulations like the GDPR and the California Privacy Rights Act (CPRA) imposing stricter requirements. Organizations are prioritizing data protection measures, including mapping data to ensure transparency and embedding privacy-by-design in products.
These strategies help align with new standards and maintain compliance amid a changing regulatory environment. 64% of legal and compliance leaders are prioritizing stronger privacy controls this year.
Stronger privacy programs now serve as both a compliance requirement and a reputational safeguard. Companies that continue treating privacy as an afterthought will struggle to defend themselves in the face of breaches, investigations, or customer scrutiny.(Gartner’s Top 5 Priorities for Compliance in 2025)
6. ESG Compliance Emphasis
Environmental, Social, and Governance (ESG) compliance is gaining prominence. Regulations such as the EU’s Corporate Sustainability Reporting Directive (CSRD) and Germany’s Supply Chain Due Diligence Act demand greater transparency in corporate sustainability practices. Companies are integrating ESG metrics and collaborating with supply chain partners to meet these requirements.
This expansion of compliance oversight reflects increasing operational resilience needs and the growing intersection between ESG reporting, ethics, and corporate accountability.(ethnicontrol)
What are the 3 C’s of compliance?
The three C’s represent the qualities that sustain a credible and functional compliance culture: Competence, Credibility, and Collaboration:
- Competence: Compliance officers and team members need strong technical knowledge of laws, regulations, and organizational policies. This includes analytical skills, risk assessment ability, and clear communication with all levels of staff. Teams using compliance technology and data analytics are better equipped to assess risk and support consistent decision-making.
- Credibility: Trust is central to compliance. A credible compliance function maintains consistency between policy and action, provides transparent guidance, and applies rules fairly. Building credibility also means addressing compliance matters with objectivity and maintaining integrity when advising leadership.
- Collaboration: Compliance cannot operate in isolation. Effective programs depend on cooperation across departments, with business units, HR, IT, and senior leadership working together to detect and prevent issues. This cross-functional approach often supports compliance roles that bridge policy, ethics, and operations.
How Do You Measure Compliance Rate?
Below are the key elements used to measure how effectively an organization meets its compliance obligations:
1. Definition and Purpose
A compliance rate measures how closely an organization follows its internal policies, legal requirements, and regulatory obligations. It serves as a quantitative indicator of adherence and helps management pinpoint weak areas before they evolve into violations. Consistent tracking also helps organizations address compliance pressures tied to oversight and reporting expectations.
2. Core Formula
The basic formula is:
Compliance rate = (Number of compliant instances ÷ Total applicable instances) × 100%
Each “instance” might represent transactions, controls, audits, training completions, or employee attestations. Clear compliance models guide how data is categorized and interpreted within these measurements.
3. Selecting What to Measure
To use this metric effectively, the first step is defining the compliance scope. Examples include:
- Policy acknowledgment rates among employees.
- Completion of mandatory training modules.
- Audit findings closed on time.
- Vendor due diligence reviews within schedule.
The scope must match the organization’s regulatory exposure and operational priorities. For many risk leaders, linking these measures to broader strategic goals helps translate compliance rate data into actionable insight.
4. Data Sources and Validation
Reliable data collection is key. Systems that track training, incident reports, access logs, and risk assessments all feed compliance measurement. Internal audit and data analytics teams often review this data to verify accuracy and improve visibility through continuous controls monitoring.
5. Weighting and Thresholds
Not all compliance areas carry equal risk. Many organizations use weighted scoring to give greater importance to high-impact controls such as anti-bribery checks or data-privacy safeguards. Thresholds for “acceptable compliance” vary—some aim for 100%, others treat 90–95% as satisfactory depending on control criticality.
6. Reporting and Context
Raw percentages alone rarely tell the full story. Compliance reports usually include trend charts, root-cause summaries, and qualitative explanations. The goal is to connect the number to real outcomes, such as fewer incidents or faster corrective actions.
7. Continuous Monitoring
Measuring compliance rate should not occur only during audits. Continuous monitoring through dashboards and automated alerts allows teams to respond quickly when rates drop or new risks appear.
Bright Defense Delivers Compliance Solutions!
If you are struggling with cybersecurity compliance challenges, Bright Defense can help. Our mission is to protect you from cybersecurity threats through continuous compliance.
Bright Defense is a cybersecurity compliance company. Our monthly engagement model delivers a robust cybersecurity program that allows you to meet compliance frameworks, including SOC 2, HIPAA, and CMMC. Once compliance certification is achieved, we constantly enhance your security program to keep up with the evolving threat landscape and compliance standards. Our compliance automation toolset gives you complete visibility into your compliance status while saving you time and money.
Ready to get started? Contact Bright Defense today!
Most programs map to the seven elements from the U.S. Sentencing Guidelines, which guide organizations across various industry sectors:
1. Standards and procedures that reflect the current compliance landscape
2. Leadership and oversight from the board and a compliance officer who manage cyber security and ethical accountability
3. Due care in authority, including screening of personnel with significant challenges or roles of high responsibility
4. Training and communication addressing social engineering and emerging technologies
5. Monitoring, auditing, and reporting, often constrained by inadequate resources or reliance on manual processes
6. Incentives and discipline that encourage responsible conduct and support operational resilience
7. Response and corrective action when issues occur, including third party due diligence
Names vary across industries, yet the substan
Many teams use a simple cycle, often mirroring PDCA, though most organizations now manage compliance manually:
1. Plan: Assess risk, address unprecedented complexity, and design controls and standards suitable for diverse industry sectors.
2. Do: Implement policies, systems, and training to reduce cyber security risk.
3. Check: Monitor and review results to spot gaps in manual processes and measure global averagecost trends.
4. Act: Investigate issues, improve guidance, and reinforce operational resilience through smarter automation.
This cycle repeats, which keeps the program current as risks change.
An accountability checklist is a structured tool that helps track commitments, responsibilities, and progress in the compliance landscape. It lists key behaviors or tasks linked to accountability, such as defining expectations, monitoring outcomes, giving feedback, and following up. Risk leaders often use it to measure how effectively individuals meet their responsibilities, especially when managing manual processes or third party due diligence.
The four main principles are:
– Responsibility / Ownership: Accepting responsibility for assigned duties and results in complex compliance landscapes.
– Transparency / Clarity: Keeping expectations, actions, and progress visible across industry sectors.
– Answerability / Explanation: Being ready to explain decisions, including cyber security responses.
– Consequences / Recourse: Rewarding success and addressing failure while maintaining operational resilience.
The five common steps for building accountability are:
1. Clarity and Authority: Define expectations, success measures, and timelines in an environment shaped by unprecedented complexity.
2. Agreement: Confirm that all participants understand their roles, especially within industry sectors facing significant challenges.
3. Track and Post: Monitor progress and share updates on issues such as global average cost and third party due diligence.
4. Coach, Mentor, and Train: Provide support to strengthen operational resilience and prepare teams for emerging technologies.
5. Reward Success or Address Failure: Recognize when most organizations adapt effectively despite inadequate resources.
-min")